Dashboard and Reports
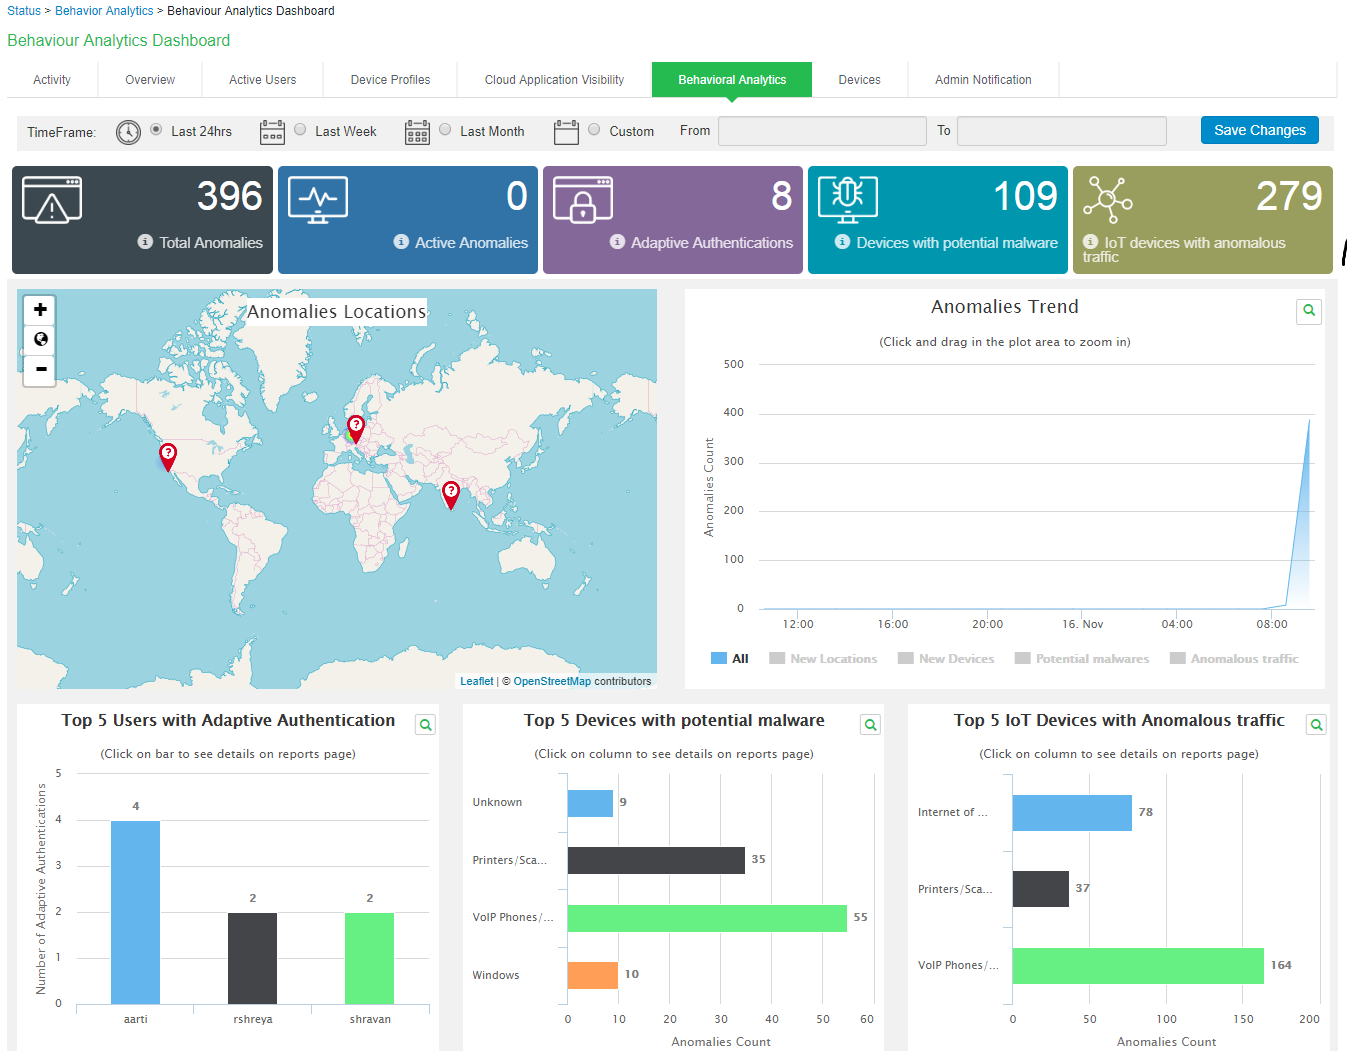
The Behavioral Analytics dashboard provides visibility to many anomalies in the network. It provides visibility of any known, active anomalies, devices with potential malware, IoT devices with anomalous traffic, anomalies location, trend and so on.
To view the Behavioral analytics dashboard:
- Select System > Status > Behavioral Analytics.
- Select the desired timeframe from available options.
- Click Save Changes.
You can also view the drill down reports such as:
- Top 5 Users with Adaptive Authentication
- Top 5 Devices with Potential Malware
- Top 5 Devices with Anomalous Traffic
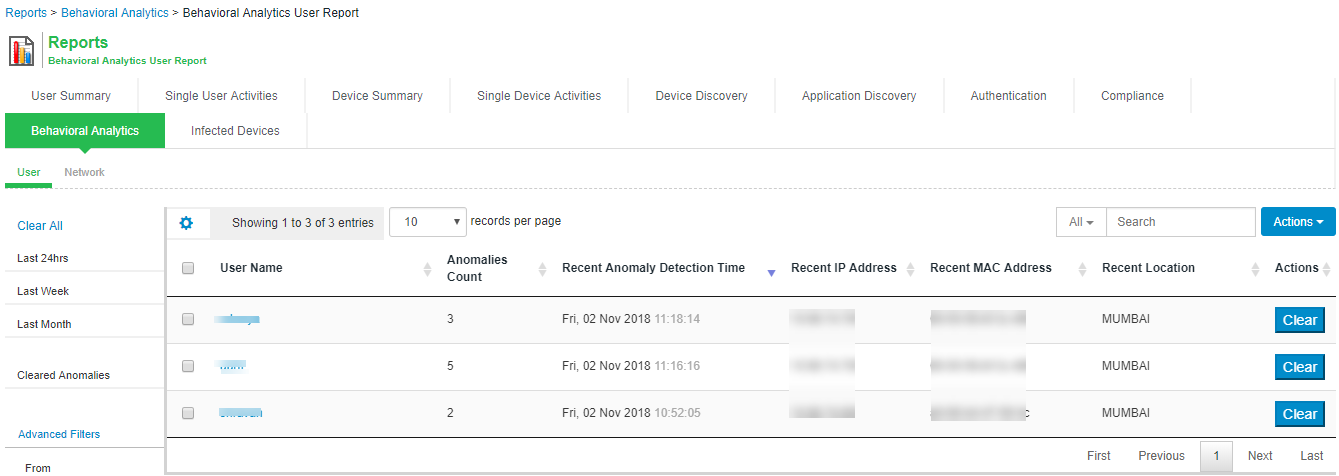
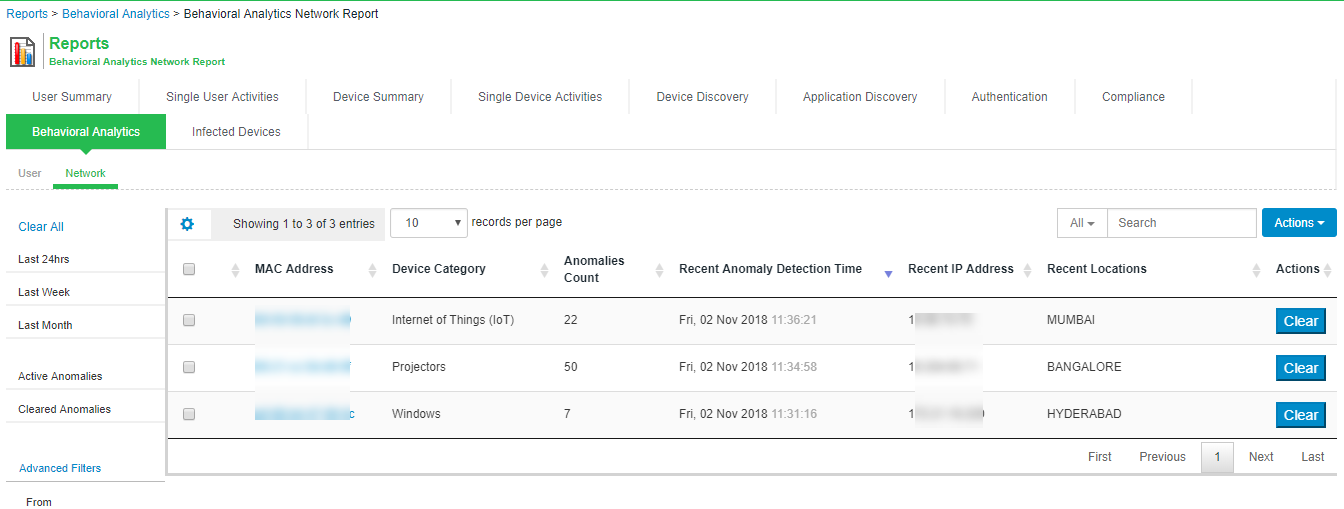
To view the Behavioural Analytics reports, select System > Reports > Behavioral Analytics.