Monitoring and Troubleshooting
If you have a problem with a cluster, a representative from Ivanti Global Support Center might ask you to create a snapshot that includes group communication statistics to assist with debugging the cluster problem. When you enable the group communication monitor, the system records statistics related to all the cluster nodes. As the local node communicates with other nodes in the cluster, the system captures statistics related to intra cluster communication. The Group Communication tab is displayed only when you enable clustering on your system. On a standalone system, you do not have access to the Group Communication tab.
You can also enable the cluster networking troubleshooting server on the Network Connectivity page.
- Enabling Monitor all cluster nodes from this node can impact system performance and stability. Perform extensive monitoring ONLY when directed by the Ivanti Support representative.
- Performing log synchronization across cluster nodes can impact your system performance and stability.
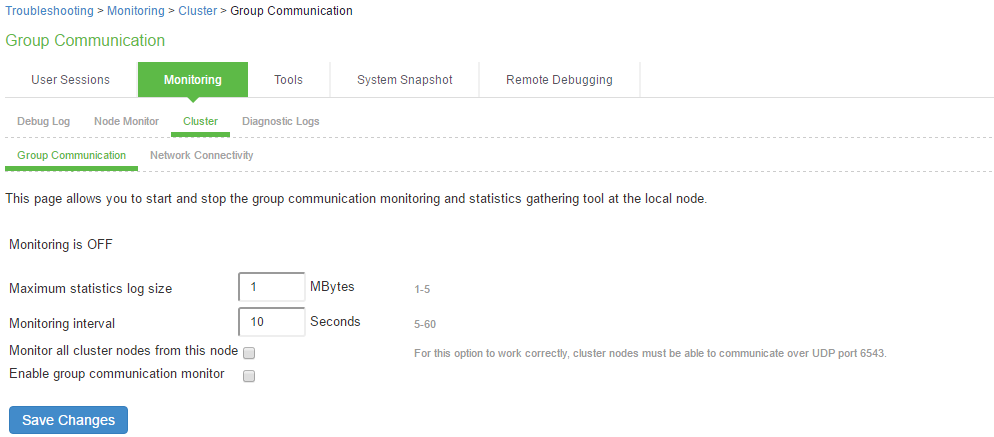
Group Communication
To enable group communication monitoring:
- Enter the maximum size of the statistics log.
- Enter the interval, in seconds, at which events are to be logged.
If you want to monitor all cluster nodes from the current local node, select the Monitor all cluster nodes from this node check box. If you do not check this option, the group communication monitor gathers statistics only for the local node.
Node monitor under Maintenance > Troubleshooting > Monitoring > Node Monitor tab which is enabled by default is NOT related to Monitor all cluster nodes from this node under Group Communication and is not known to cause any system impact.
If you select the Monitor all cluster nodes from this node option, the cluster nodes must be able to communicate over UDP port 6543
- Select the Enable group communication monitoring check box to start the monitoring tool.
- Click Save Changes.
- If you want to include the node monitoring results in the system snapshot, choose Maintenance > Troubleshooting > System Snapshot, and select the Include debug log check box.
- Take a system snapshot to retrieve the results.
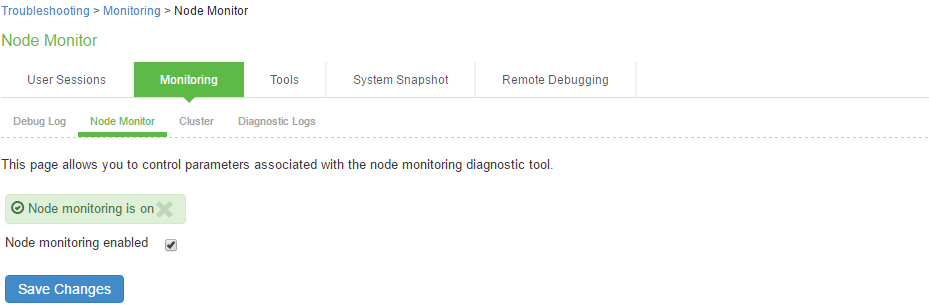
Node Monitoring
To enable node monitoring:
- Select Maintenance > Troubleshooting > Monitoring > Node Monitor to enable the node monitor.
- Enter the maximum size for the node monitor log.
- Enter the interval, (in seconds) at which node statistics are to be captured.
- Select the Node monitoring enabled check box to start monitoring cluster nodes.
- For Maximum node monitor log size, enter the maximum size (in MB) of the log file. Valid values in the range of 1 - 30.
- Specify the interval (in seconds) that defines how often nodes are to be monitored.
- Select the commands to use to monitor the node.
- If you select dsstatdump, enter its parameters as well.
- Click Save Changes.
- To include the node monitoring results in the system snapshot, select Maintenance > Troubleshooting > System Snapshot, and select the Include debug log check box.
- Take a system snapshot to retrieve the results.
Network Connectivity Monitoring
Use the Network Connectivity tab to enable the cluster node troubleshooting server and to select a node on which to perform troubleshooting tasks. The troubleshooting tool allows you to determine the network connectivity between cluster nodes.
The server component of this tool runs on the node to which connectivity is being tested. The client component runs on the node from which connectivity is being tested. The basic scenario for testing connectivity is this:
- The administrator starts the server component on the passive node.
- The administrator tests the connectivity to the server node from the Active node, by starting the client component on the active node and then contacting the passive node running the server component.
The server component must be run on nodes that are configured as either standalone or in a cluster but disabled. Cluster services cannot be running on the same node as the server component.
To enable network connectivity monitoring:
- Select Maintenance > Troubleshooting > Cluster > Network Connectivity and Enable cluster network troubleshooting server check box to enable the server component.
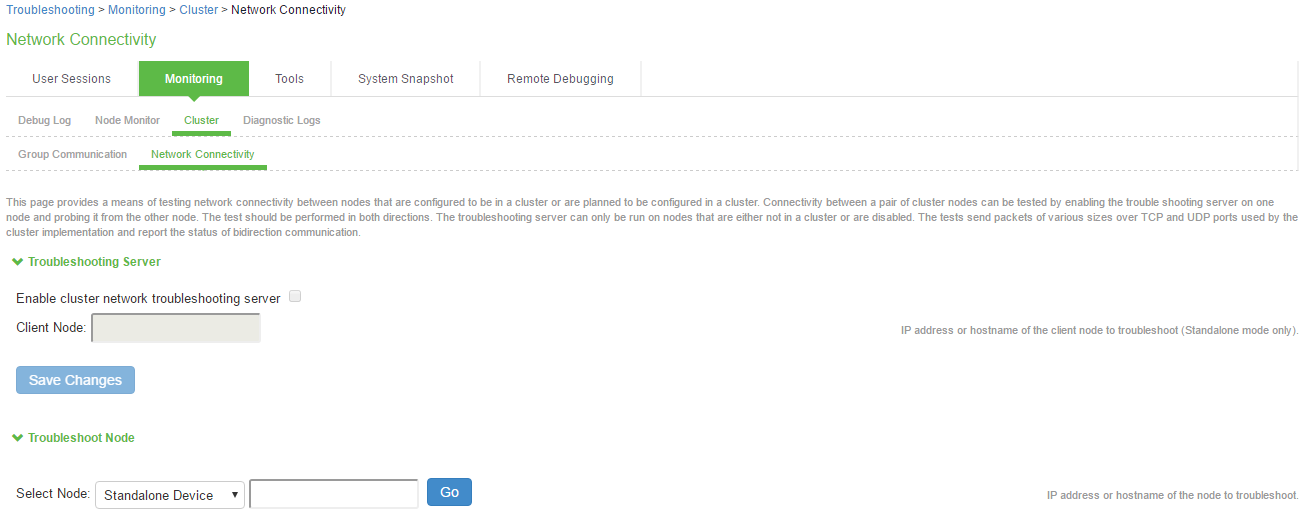
- Click Save Changes.
-
On another machine, select Maintenance > Troubleshooting > Cluster > Network Connectivity.
Perform one of the following steps:
- Select a node from the list.
- Enter the IP address of the server node.
- Click Go to begin troubleshooting the machine on which the server component is running.
- Click the Details link below the fields to view the results.
Monitoring using SNMP Traps
You can monitor clusters using the standard logging tools. Specifically, you can use several cluster-specific SNMP traps to monitor events that occur on your cluster nodes, such as:
- External interface down
- Internal interface down
- Disabled node
- Changed virtual IP address (VIP)
- Deleted cluster node (cluster stop)
In general, it is desirable to configure your SNMP traps on a clusterwide basis so that any given cluster node can send its generated traps to the right target. Setting up clusterwide configuration for the traps is particularly important when you also use a load balancer, because you might not know which node is responsible for a specific operation. In that case, the load balancer can independently determine which cluster node can manage an administrative session.
You can use SNMP traps that are included in the Ivanti Standard MIB to monitor these events. These traps include:
- iveNetExternalInterfaceDownTrap—Supplies type of event that brought down the external interface.
- iveNetInternalInterfaceDownTrap—Supplies type of event that brought down the internal interface.
- iveClusterDisableNodeTrap—Supplies the cluster name on which nodes are disabled, along with a space-separated list of disabled node names.
- iveClusterChangedVIPTrap—Supplies the type of the VIP, whether external or internal, and its value before and after the change.
- iveClusterDelete—Supplies the name of the cluster node on which the cluster delete event was initiated.
These traps are always enabled and available in the MIB. You cannot disable the traps.
Troubleshooting
You can use a built-in feature on the clustering Status page to identify the status of each cluster node. Mouse over the Status light icon to display a tool tip containing a hexadecimal number. The hexadecimal number is a snapshot of the status of the system.
|
Value |
Meaning |
|---|---|
|
0x000001 |
System is in standalone mode. |
|
0x000002 |
System is in cluster disabled state. |
|
0x000004 |
System is in cluster enabled state. |
|
0x000008 |
System is unreachable (because it is offline, has the wrong password, has a different cluster definition, different version, or other problem). |
|
0x00002000 |
The node owns the VIPs (on) or not (off). |
|
0x000100 |
System is synchronizing its state from another node (initial synchronizing phase). |
|
0x000200 |
System is transitioning from one state to another. |
|
0x00020000 |
Group communication subsystems at the local and remote nodes are disconnected from each other. |
|
0x00040000 |
Management interface (mgt0) is displayed disconnected. |
|
0x00080000 |
Management gateway is unreachable for ARP ping. |
|
0x000800 |
Interface int0 displays disconnected (no carrier). |
|
0x001000 |
Interface int1 displays disconnected (no carrier). |
|
0x002000 |
System is syncing its state to another node that is joining. |
|
0x004000 |
Initial Synchronization as master or slave is taking place. |
|
0x008000 |
System is the leader of the cluster. |
|
0x010000 |
The spread daemon is running and the cache server is connected to it. |
|
0x020000 |
The gateway on int0 is unreachable for ARP pings (see log file). |
|
0x040000 |
The gateway on int1 is unreachable for ARP pings (see log file). |
|
0x080000 |
Leader election is taking place. |
|
0x100000 |
Server lifecycle process is busy. |
|
0x200000 |
System is performing post state synchronization activities. |
|
0x30004 |
The spread daemon is running and the cache server is connected to it. The gateway on int0 is unreachable for ARP pings (see log file). System is in cluster enabled state. |
|
0x38004 |
The spread daemon is running and the cache server is connected to it. The gateway on int0 is unreachable for ARP pings (see log file). System is the leader of the cluster. System is in cluster enabled state. |
Each code, as you see it in the system, may relate specifically to one state. However, each code may represent a combination of states, and so the actual code does not appear in the above table. Instead, the code you see in the system is the sum of several of the hexadecimal numbers shown above. You will need to factor out the codes, as in the following example:
- 0x38004—The rightmost digit (4) in this hexadecimal number corresponds to:
- 0x000004—The system is in a cluster enabled state.
- 0x38004—The digit in the fourth position from the right (8) corresponds to:
- 0x008000—This system is the leader of the cluster.
- 0x38004—The leftmost digit (3) in this hexadecimal number does not exist in the table, which indicates that it corresponds to the sum of two other digits, in this case, 1 and 2, as shown in the following codes:
- 0x020000—The gateway on int0 is unreachable for ARP pings (see log file).
- 0x010000—The spread daemon is running and the cache server is connected to it.
Restarting or Rebooting Cluster Nodes
When you create a cluster of two or more nodes, the clustered nodes act as a logical entity. When you reboot one of the nodes using either the serial console or the admin console, all nodes in the cluster restart or reboot.
To reboot only one node:
- Select System > Clustering > Status to disable the node you want to restart or reboot within the cluster.
- Select Maintenance > System > Platform.
- Reboot the node, then enable the node within the cluster again.