Displaying System Logs
This topic describes how to display local system logs.
Displaying Events Logs
The Events logs include system events, such as session timeouts, system errors and warnings, requests to check server connectivity, and system restart notifications. The local log viewer displays the most recent 5000 log messages (the display limit).
To display Events logs:
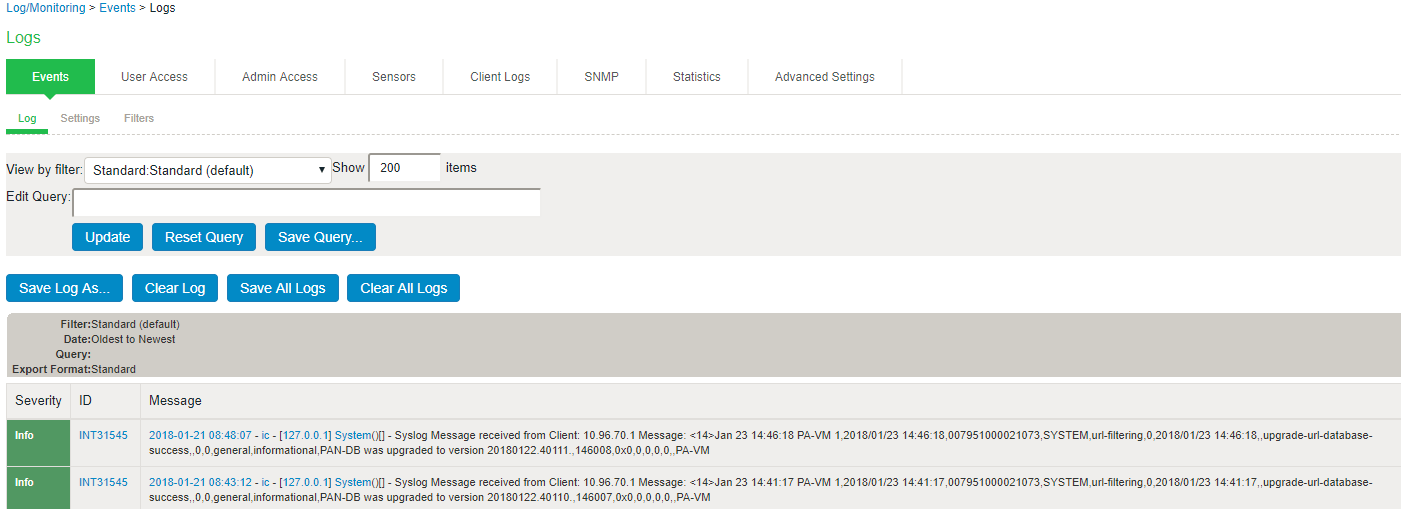
- Select System > Log/Monitoring.
- Click the Events tab.
- Click the Log tab to display the log page.
- Use the features described in table to examine log records or manage the log collection.
|
Controls |
Description |
|---|---|
|
Filter |
Select a filter format. Any custom filter formats and the following predefined filter formats are available: •Standard (default)—This log filter format logs the date, time, node, source IP address, user, realm, event ID, and message. •WELF—This customized WebTrends Enhanced Log Format (WELF) filter combines the standard WELF format with information about the system realms, roles, and messages. •WELF-SRC-2.0-Access Report—This filter adds access queries to the customized WELF filter. You can use this filter with NetIQ’s SRC to generate reports on user access methods. Format filters change only the data displayed (or columns exported), and do not affect the log data that has been collected. |
|
Query |
In the log display, several fields are hyperlinks. The hyperlinks function as dynamic queries on the local log collection. For example, if you click the log ID, the date, or an IP address or username, the log viewer queries the log collection for records that match the value you clicked, and redisplays the log collection. You can apply additional query filters by clicking additional hyperlinked values, essentially creating a Boolean AND query (for example, date AND IP address). Use the Reset Query button to clear the query filters and redisplay the unfiltered log collection. Use the Save Query button to save the dynamic log query as a custom filter. When you click the Save Query button, the system displays the Filters tab displays with the Query field prepopulated with the variables you selected from the log. Query filters change only the display (or rows exported), and do not affect the log data that has been collected. |
|
Save Log As |
Save the local log collection to a file. We recommend you retain the system generated log name, which follows a consistent convention: pulsescure.logtype.nodename.log. The local log viewer displays the most recent 5000 log messages (the display limit). If the current log file contains fewer than 5000 log messages, older log messages from the backup log file are displayed, up to a total of 5000 log messages. This makes the log files appear as one, even though they are stored separately. When you save the log messages or use the FTP archive function, the backup log file is appended to the current log file, and is then downloaded as one log file. If the log files are not archived or saved by the time they are rolled over again, the oldest log messages (saved in the backup log file) are lost. |
|
Clear Log |
Clear the local log and log.old file. When you clear the local log, events recorded by the syslog server are not affected. Subsequent events are recorded in a new local log file. |
|
Save All Logs |
The Save All Logs button appears on the Events, User Access, and Admin Access tabs. When you click Save All Logs, the system generates a file that includes event, user access, admin access, and XML data for all of the system statistics and graphs shown on the Status > Overview page. After you click Save All Logs, you are prompted to download a file named pulsesecurelogs-graphs.tar.gz to your local host. |
|
Clear All Logs |
The Clear All Logs button appears on the Events, User Access, and Admin Access tabs. It clears event, user access, admin access, and XML data for all of the system statistics and graphs shown on the Status > Overview page. When you clear the local log, events recorded by the syslog server are not affected. Subsequent events are recorded in a new local log file. |
Displaying User Access Logs
The User Access logs include information about user access, such as the number of simultaneous users at each one hour interval (logged on the hour) and user sign-ins and sign-outs. The local log viewer displays the most recent 5000 log messages (the display limit).
To display User Access logs:
- Select System > Log/Monitoring.
- Click the User Access tab.
- Click the Log tab.
Displaying Admin Access Logs
The Admin Access logs include information about administrator actions, such as administrator changes to user, system, and network settings. It includes a log entry whenever an administrator signs in, signs out, or changes licenses on the appliance. The local log viewer displays the most recent 5000 log messages (the display limit).
To display Admin Access logs:
- Select System > Log/Monitoring.
- Click the Admin Access tab.
- Click the Log tab.
- Use the features to examine log records or manage the log collection.