Using the Troubleshooting Tools
•Using Network Troubleshooting Commands
•Troubleshooting TCP and UDP Port Status
Introduction
The Troubleshooting page enables you to investigate issues that might be affecting your Gateway or preventing it from operating normally.
This page is intended to enable Ivanti Technical Support teams to help resolve problems with your Gateway infrastructure. Due to the potential for system performance to be impacted through the use of these features, Ivanti recommends you only use this page when advised to do so.
The following tools are available through the Gateways > Troubleshooting page:
- Debug logs - Work with Ivanti Technical Support teams to diagnose system issues.
- Node Monitoring - Create a snapshot that includes node monitoring statistics to assist Ivanti Technical Support team in debugging the problem.
- Network troubleshooting commands - Use standard network commands, such as ping, traceroute, NSlookup, and other commands to diagnose networking issues.
- System snapshots - Work with Ivanti Technical Support teams to reproduce and diagnose system issues.
- tcpdump - Sniff packet headers to diagnose networking issues.
To access Troubleshooting page:
-
Log in to the Ivanti Neurons for Secure Access portal as a Tenant Admin. See Logging in to Ivanti Neurons for Secure Access.
-
Use the Gateway Switcher and select Ivanti Connect Secure.
-
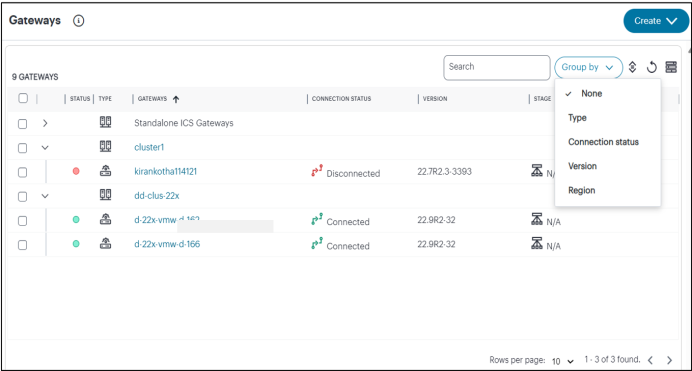
From the Ivanti Connect Secure menu, click the Gateways icon, then select Gateways > Gateways List.
The All Gateways page is displayed showing a list of standalone ICS Gateways and cluster nodes.
-
In the All Gateways page, double-click the required Gateway from the list.
-
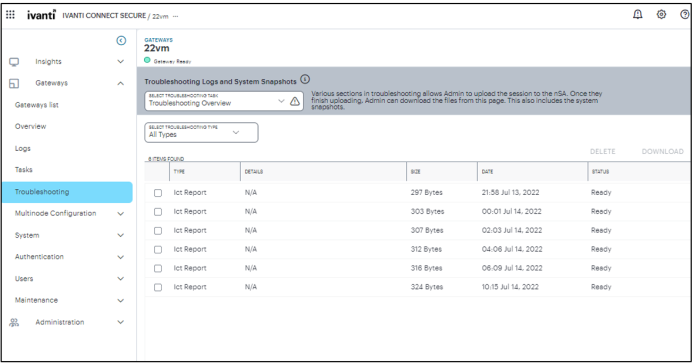
From the Ivanti Connect Secure menu, click the Gateways icon, then select Gateways > Troubleshooting.
The Troubleshooting Overview page appears. The table contains a list of all captured data based on your completed troubleshooting activities.
-
To download log file, select the corresponding radio button, and from the Actions drop-down select Download.
-
To remove log from the list, select the corresponding radio button, and from the Action drop-down select Delete.
-
To filter the displayed files to a single type, from the Select Troubleshooting Type drop-down list, select the required type. Options available: Debug Log, Snapshot, TCP Dump.
Using the Debug Log
The Ivanti Technical Support teams might direct you to create a debug log to assist them in helping you debug an issue with the system.
To use debug logging:
-
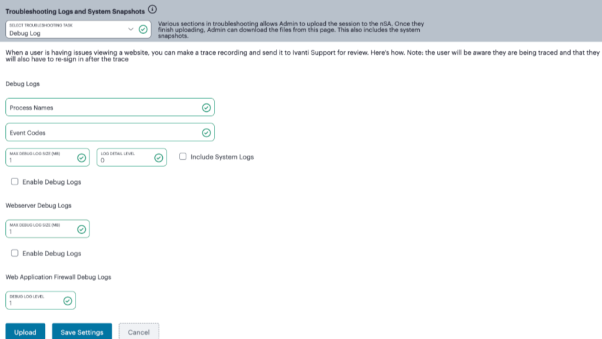
From the Troubleshooting Logs and System Snapshots drop-down menu, select Debug Log.
-
Specify the Process Name.
-
Specify the Event Code.
-
Specify a Maximum debug log file size. The default is 2 MB. The minimum debug log file size is 1 MB and the maximum file size is 250 MB. For Gateways with disk space > 80 GB, the maximum debug log file size is 1024 MB.
-
Specify the debug Log detail level.
-
Select Include System Logs* option to include system logs in the debug log file. Recommended.
-
Select Enable Debug Logs.
- Under Web Server Debug Logs, select Max debug log file size. The minimum debug log file size is 1 MB and the maximum file size is 250 MB. For Gateways with disk space > 80 GB, the maximum debug log file size is 1024 MB.
-
Select Enable Debug Logs.
-
Under Web Application Firewall Debug Logs, specify the debug log severity level. The debug log level should be between 1 and 9.
-
Click Save Settings. The system begins generating debug log entries.
-
Click Upload.
A confirmation message is displayed. You can then download the file from the Troubleshooting Overview page and analyze the logs.
Under Debug Logs:
Using Node Monitoring
When you enable the node monitor, the ICS Gateway captures certain statistics specific to the nodes on your system. Using the snapshot that results, the support team can identify important data, such as network statistics and CPU usage statistics. Ensure this option is always enabled to help in debugging and monitoring system issues.
To enable node monitoring:
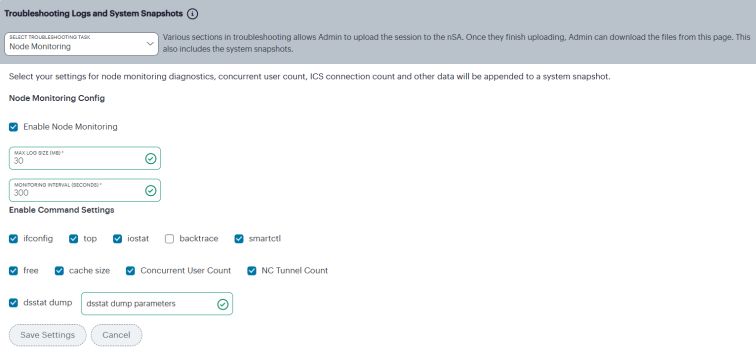
1.From the Troubleshooting Logs and System Snapshots drop-down menu, select Node Monitoring.
2.Select Enable Node Monitoring check box.
3.Enter the maximum size for the node monitor log.
4.Enter the interval, in seconds, at which node statistics are to be captured.
5.Select the commands to use to monitor the node.
6.If you select dsstatdump, enter its parameters as well.
7.Click Save Save Settings.
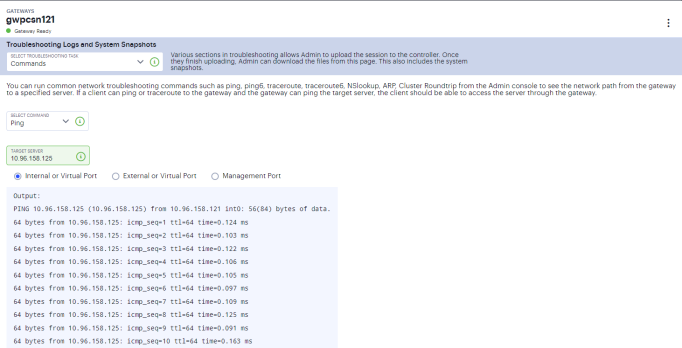
Using Network Troubleshooting Commands
You can run common network troubleshooting commands such as arp, ping, ping6, traceroute, traceroute6, NSlookup, and AvgRTTs from the admin console. You can use these connectivity tools to see the network path from the system to a specified server. If a client can ping or traceroute to the access system, and the access system can ping the target server, any remote users should be able to access the server through the access system.
To run network troubleshooting commands:
-
From the Troubleshooting Logs and System Snapshots drop-down menu, select Commands.
-
Select a network troubleshooting command from the options:
- Ping/Ping6
- Traceroute/Traceroute6
- NSLookup
- ARP
- AvgRTTs
- Portprobe
- Cluster Roundtrip
-
When prompted:
- Specify the IP address or hostname for the target server.
- Select the interface from which to send the command.
-
Click Start to run the command and write the output to the screen.
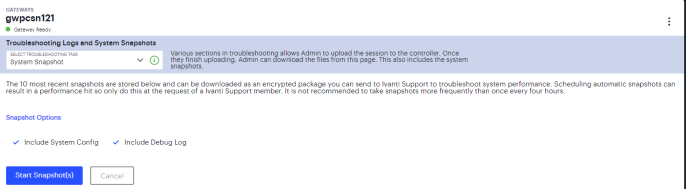
Using System Snapshots
A snapshot of the system state captures details that can help Ivanti Technical Support teams diagnose system performance problems. The system stores up to ten snapshots, which are packaged into an encrypted "dump" file that you can download and then e-mail to Ivanti Technical Support teams.
To create and manage system snapshots:
-
From the Troubleshooting Logs and System Snapshots drop-down menu, select System Snapshots.
-
Select Include system config to include the system configuration file in the snapshot.
-
Select Include debug log to include debug logs (if any).
-
Click Start Snapshot(s).
A confirmation message is displayed. You can then download the file from the Troubleshooting Overview page and analyze the logs.
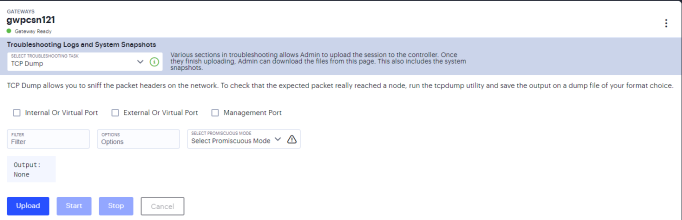
Using the TCP Dump Utility
To use TCP Dump utility:
-
From the Troubleshooting Logs and System Snapshots drop-down menu, select TCP Dump.
-
Configure the following:
- Select the ports on which to sniff (Internal, External, Management).
- Specify a Filter expression.
- Select a promiscuous mode option.
-
Click Start to start the TCP Dump process.
-
Click Stop to write the TCP Dump output to the screen.
-
Click Upload.
A confirmation message is displayed. You can then download the file from the Troubleshooting Overview page and analyze the logs.
Troubleshooting TCP and UDP Port Status
You can use the Portprobe command to display the Transmission Control Protocol (TCP) or the User Datagram Protocol (UDP) port status (open or closed).
A TCP port can be closed under two conditions:
•The system sends a connection request to the back-end server port and the back-end server closes the connection (sends an RST packet).
•The connection request times out because the back-end server is not found, or the back-end server is too busy to respond to the connection request.
If either of these conditions occurs, the system sends a ping command to the back-end server. If the ping command is successful, the back-end server is considered reachable, but the back-end server port is closed. If the ping command fails, the back-end server is considered unreachable.
For UDP ports, the system sends a UDP datagram with a ping to the back-end server port. If the back-end server responds with Internet Control Message Protocol (ICMP) port unreachable or ICMP unreachable, the back-end port is considered unreachable. If the back-end server responds with ICMP host unreachable then the back-end server is considered unreachable.
To troubleshoot the TCP or UDP port:
1.From the Troubleshooting Logs and System Snapshots drop-down menu, select Commands.
2.From the Select Command drop-down list, select Portprobe.
3.Enter the target server and port number. You can enter an IP address, hostname or FQDN for the target server.
4.Select either TCP or UDP as Protocol.
5.Enter the probe count. This is the number of times the system attempts to communicate with the back-end server port. The default for TCP is one; the default for UDP is five.
6.Enter the probe timeout. This is the number of seconds the system waits for a response from the back-end server port.
7.Select either the internal port or the management port. If the management port is not configured, it is not displayed.
8.If using an internal port, select the internal VLAN port from the list.
9.Click OK.