Viewing Log Aggregation and Analysis
The syslog forwarded from the configured PCS/PPS appliances can be viewed in Appliance Logs > Default Queries > Managed Appliances. Here, users have a consolidated view of logs generated by every PPS/PCS appliance that is configured to forward syslogs to the Pulse One server.
To view logs output by Pulse One, see Viewing Services Logs.
The system provides a set of Appliance Logs > Managed Appliances > Default Queries in the navigation pane.

To view logs from any of the default queries, expand Appliance Logs > Default Queries and click on the required query.
The Administrator can also customize the queries and save them for future use. These customized queries are then listed below Saved Queries, see Working with Log Queries.
Working with Log Queries
The Appliance Logs > Default Queries page supports filtering using a string token. Type the token in the search bar or double-clicking a string in the logs details. The view is then filtered to display all messages with the token that is being searched for. Users can enter multiple tokens separated by space.
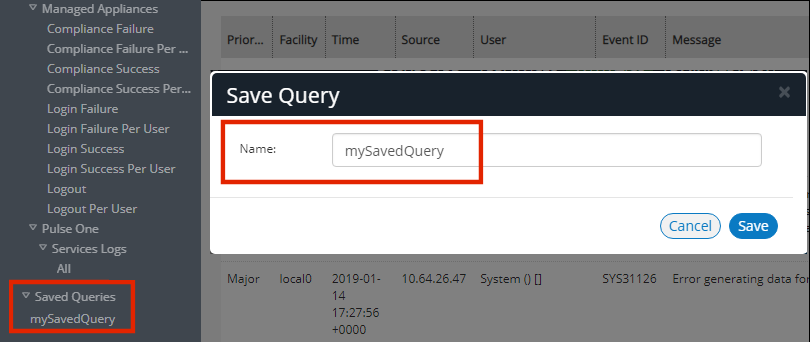
This customized query can then be saved using Save As.
To view logs from a customized query, expand Saved Queries and click on the required query. For example:
It is also possible to filter the logs by timestamp. This can be done by choosing a From date and To date in the date fields on the top-right corner of the panel.
Users can also choose to filter search results by Match All (which will display search results that have all specified tokens) or Match Any (which will display search results that include any of the specified tokens).
The number of search results to be displayed on the screen can be 50, 100, 250, 500 by making a choice on the bottom left corner of the screen. Finally, the search results can span over multiple pages and navigated using the buttons on the bottom right corner of the screen.
Saved queries can be deleted using the Delete Query feature.