Working with the Pulse One Dashboard
Viewing Overall System Health
To view metrics for system health, select the Dashboard tab, and then select the Overall tab. For example:
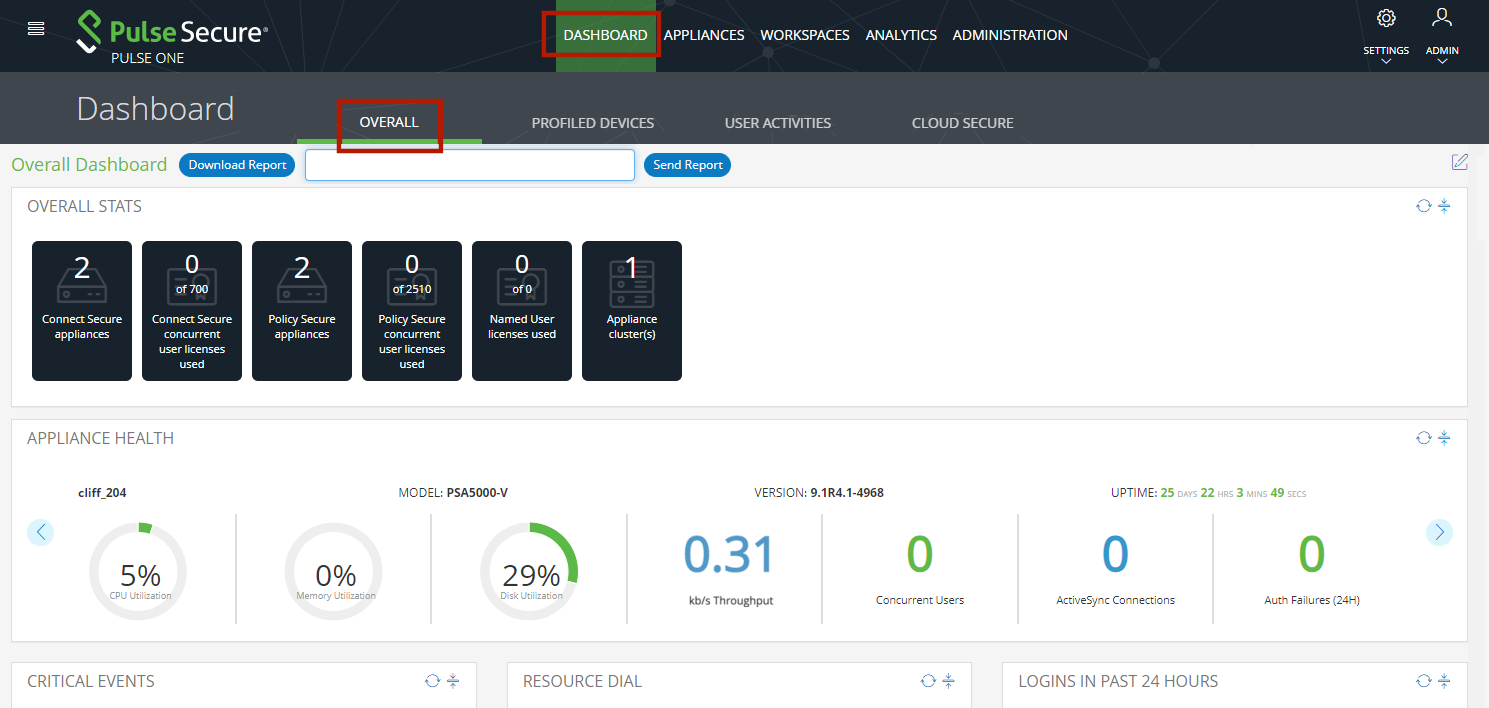
![]() This dashboard includes the following widgets by default:
This dashboard includes the following widgets by default:
Each widget that can be refreshed by clicking Reload Widget Content (![]() ) and collapsed by clicking Collapse/Expand Widget (
) and collapsed by clicking Collapse/Expand Widget (![]() ).
).
Click Download Report to create and download a multi-page PDF report that includes each widget that currently displays a populated graph. To send the graph via email, enter an email address and click Send Report. See Exporting Dashboard Information.