Logging and Monitoring
Logging Overview
The system generates event logs related to system performance, administrator actions, network communications, access management framework results, user sessions, and so forth. The system supports the following log collection methods:
•Local log collector and log viewer.
•Reporting to syslog servers.
•Reporting to SNMP servers.
The following table describes the event log severity levels.
The following table lists the Event Log Severity Levels:
|
Severity Level |
Description |
|
Critical (level 10) |
The system cannot serve user and administrator requests or loses functionality to a majority of subsystems. |
|
Major (levels 8-9) |
The system loses functionality in one or more subsystems, but users can still access the system for other access mechanisms. |
|
Minor (levels 5-7) |
The system encounters an error that does not correspond to a major failure in a subsystem. Minor events generally correspond to individual request failures. |
|
Info (levels 1-4) |
The system writes an informational event to the log when a user makes a request or when an administrator makes a modification. |
In addition to managing system logs, you can use the admin console to configure collection of client-side logs, including:
•Host checker
•Meetings
•Windows Secure Application Manager
•Java Secure Application Manager and Applet Rewriting
•VPN Tunneling
•Terminal Services
•Virtual Desktops
Configuring Events to Log
To configure log event categories:
1.Select System > Log/Monitoring.
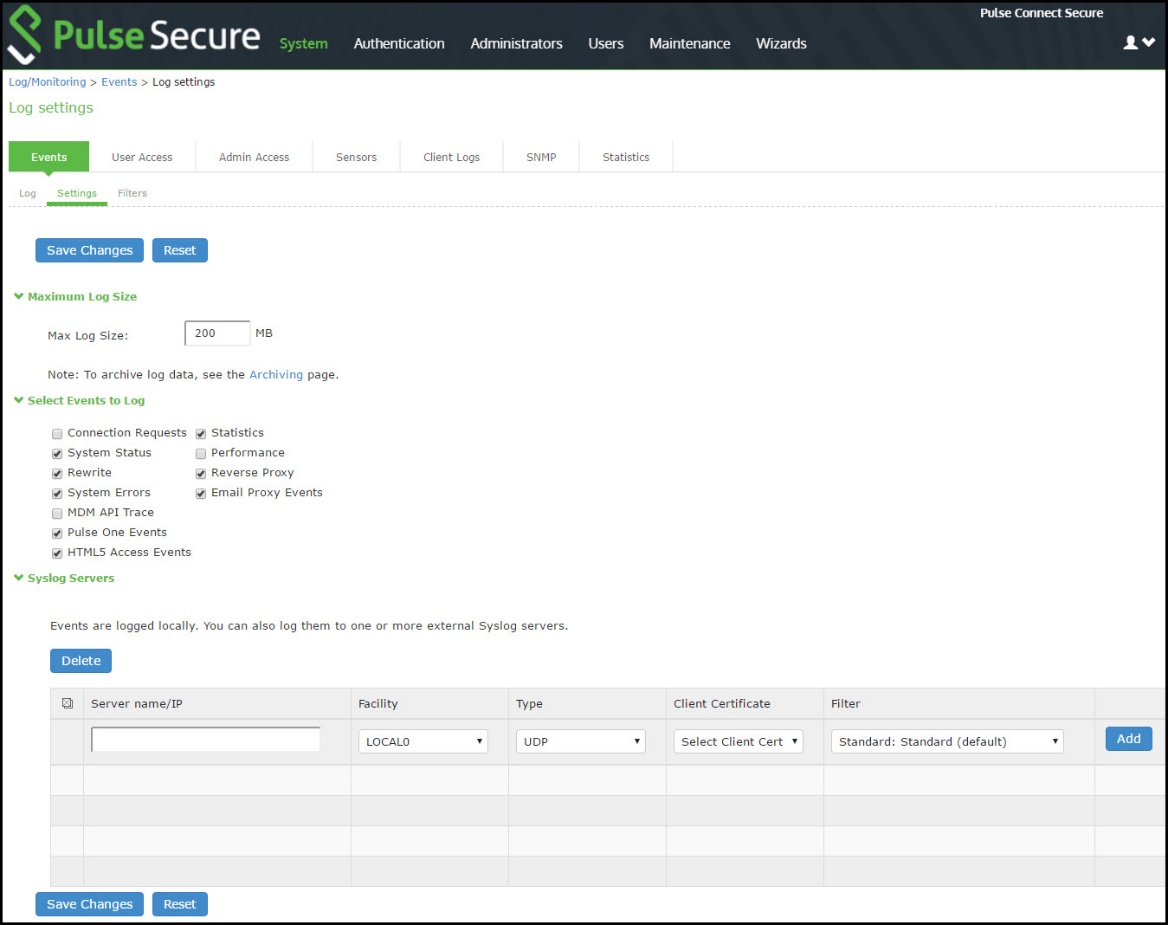
2.Click the Settings tab to display the configuration page.
Log Events Settings Configuration Page shows the configuration page.
3.Complete the configuration as described in Table.
4.Save the configuration.
To configure log events for each local log category, you must perform this procedure on each local log tab: Events, User Access, Admin Access, and Sensors.
Log Events Settings Configuration Page
The following table lists the Log Events Settings:
|
Settings |
Guidelines |
|
Max Log Size |
Specify the maximum size of the local log. The default is 200 MB. The maximum is 500 MB. The default is a good choice for logs formatted with the Standard format. If you use a more verbose format, such as WELF, specify a larger value. When the local log reaches the maximum log size, the current data is rolled over to a backup log file. A new, empty, file is then created for all subsequent (new) log messages. The log viewer displays the most recent 5000 log messages (the display limit). If the current log file contains fewer than 5000 log messages, older log messages from the backup log file can be displayed, up to a total of 5000 log messages. This makes the log files appear as one, even though they are stored separately. When you save the log messages or use the FTP archive function, the backup log file is appended to the current log file and is then downloaded as one log file. If the log files are not archived or saved by the time they are rolled over again, the oldest log messages (saved in the backup log file) are lost. |
|
Archiving |
Click the Archiving link to display the configuration page for Archiving jobs, including log archiving. |
|
Select Events to Log - Events Tab |
|
|
Connection Requests |
Log events related to connection requests. |
|
System Status |
Log events related to changes in system status. |
|
Rewrite |
Log events related to rewrite policies. |
|
System Errors |
Log events related to system errors. |
|
Statistics |
Log user access statistics reported on the System > Log/Monitoring > Statistics tab. If you unselect the Statistics option, the statistics are not written to the log file, but are still reported on the statistics page. |
|
Performance |
Log events related to SiteMinder. |
|
License Protocol Events |
Log events related to licensing. |
|
Reverse Proxy |
Logs events related to reverse proxy information. |
|
Select Events to Log - User Access Tab |
|
|
Login/logout |
Log events related to sign in and sign out. |
|
SAM/Java |
Log events related to user access to SAM/Java in the local log file. |
|
User Settings |
Log events related to changes to user settings in the local log file. |
|
Meeting Events |
Log events related to meeting information. |
|
Client Certificate |
Log events related to certificate security. |
|
IF-MAP Client User Messages |
Log events related to IF-MAP. |
|
Pulse Client Messages |
Log events related to Pulse clients. |
|
HTML5 Access |
Log events related to HTML5 access. |
|
Web Requests |
Log events related to user access to web. |
|
File Requests |
Log events related to user access to files. |
|
Meeting |
Log events related to user access to meetings. |
|
Secure Terminal |
Log events related to user access to secure terminal. |
|
VPN Tunneling |
Log events related to user access to VPN tunneling. |
|
SAML |
Log events related to user access to SAML. |
|
System Too Busy |
Log events related to PCS overload. |
|
Unauthenticated Web Requests |
Log events related to web requests before authentication. By default, this checkbox is disabled. |
|
Select Events to Log - Admin Access Tab |
|
|
Administrator changes |
Log events related to configuration changes. |
|
Administrator logins |
Log events related to administrator access. |
|
License changes |
Log events related to licensing. |
|
Select Events to Log - Sensor Tab |
|
|
Max Log Size (MB) |
Specifies the maximum file size for the local log file. The default value is 200 MB. The maximum value is 500 MB. |
Enabling Client-Side Logging
Client-side logging is not enabled by default. If necessary, you can enable client-side logging to troubleshoot any client application issues.
To enable client-side logging:
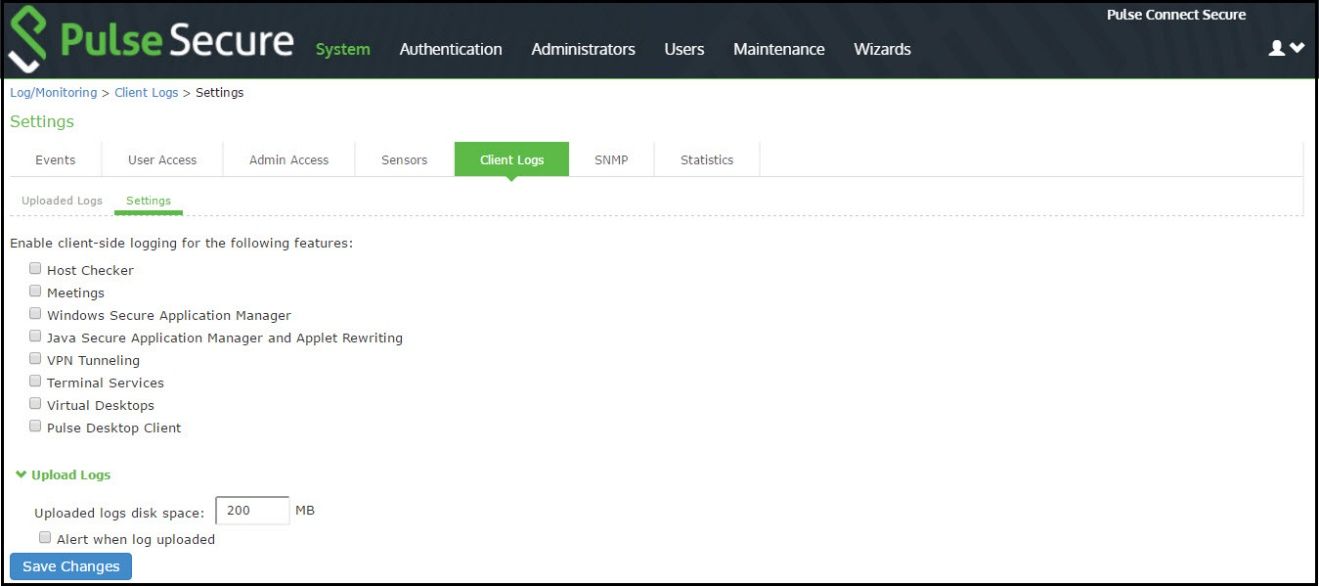
1.Select System > Log/Monitoring.
Click the Client Logs tab to display the configuration page. Figure 244 shows the configuration page for Pulse Connect Secure. Complete the configuration as described in Table.
2.Save the configuration.
Client Logs Configuration Page
The following table lists the Client-Side Logs Settings:
|
Settings |
Guidelines |
|
Host Checker |
Select this option to enable client-side logging of Host Checker. |
|
Meetings |
Select this option to enable client-side logging of secure meeting. |
|
Windows Secure Application Manager |
Select this option to enable client-side logging of PSAM. |
|
Java Secure Application Manager and Applet Rewriting |
Select this option to enable client-side logging of JSAM and applet. |
|
VPN Tunneling |
Select this option to enable client-side logging of VPN tunneling. |
|
Terminal Services |
Select this option to enable client-side logging of terminal services. |
|
Virtual Desktops |
Select this option to enable client-side logging of virtual desktops. |
|
Pulse Desktop Client |
Select this option to enable client-side logging of Pulse desktop clients. |
|
Upload logs |
|
|
Upload logs disk space (MB) |
Specify the amount of disk space (in Megabytes) you want to allocate for uploaded client log files. You can allocate disk space from 0 to 200 MB. |
|
Alert when log uploaded |
Select this option to receive an alert message when an end user pushes a log file. |
Enabling and Viewing Client-Side Log Uploads
If you enable client-side logging for system features, you can also enable automatic upload of those logs at the role level. When you do, end users and Pulse Collaboration attendees who are members of the enabled roles can choose to push their log files up to the system at will. Then, you can view the uploaded files through the System > Log/Monitoring > Client Logs > Uploaded Logs page of the admin console.
When you upload log files to a device that is a node in a cluster, keep the following guidelines in mind:
•You can use the Log Node column on the System > Log/Monitoring > Client Logs > Uploaded Logs tab to view the location of existing log files collected by nodes in the cluster. This is specific to a cluster setup and does not apply to a single deployment.
•The user uploads logs to the cluster node to which he is connected.
•You can view upload log entries across all nodes in a cluster. You can save and unzip your uploaded log files from the respective nodes in the cluster where the user uploaded the logs.
•When a node is removed from a cluster, the system deletes the logs of that node from the Uploaded Log List in the cluster and from the node.
To enable end users to upload logs to the system:
1.Select Users > User Roles > Select Role > General > Session Options.
•In the Upload logs section, select the Enable Upload Logs check box.
•Click Save Changes.
Viewing Uploaded Client-Side Logs
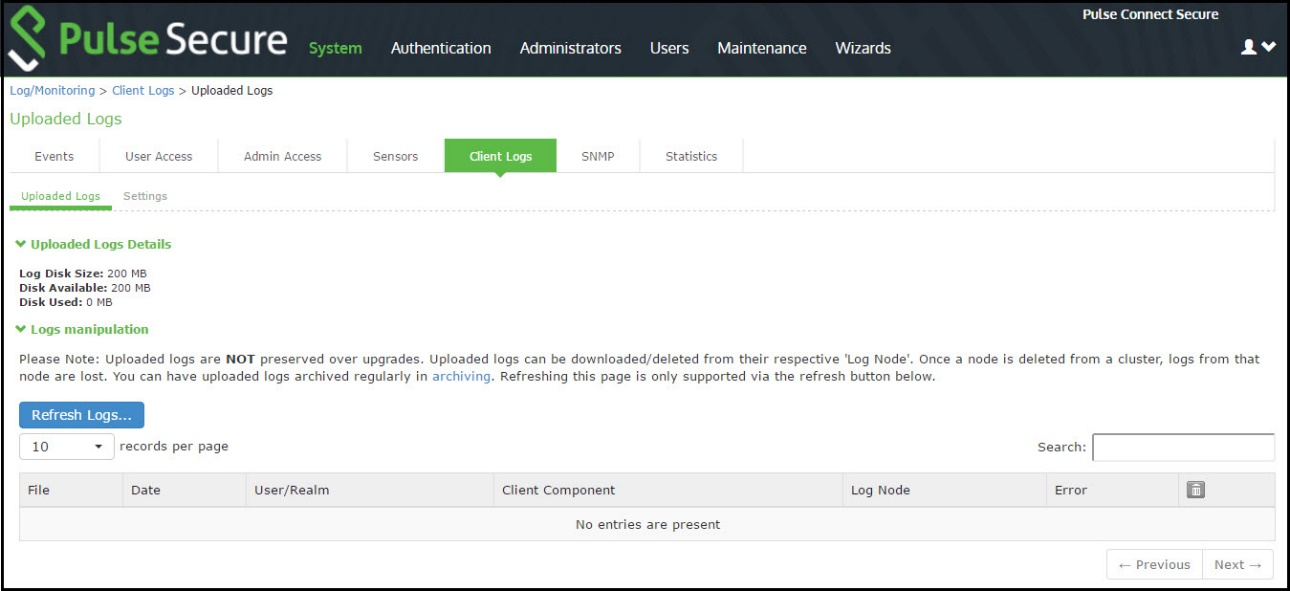
If you enable end users to push log files up to the system, you can view the uploaded logs through the System > Log/Monitoring > Client Logs > Uploaded Logs page of the admin console. This page displays a list of uploaded log files from clients, featuring information such as the file name, date, associated user and/or realm, client access component type, and the log node.
The system does not preserve uploaded logs when you upgrade the system software. To preserve the logs, you may archive them using options in the Maintenance > Archiving > Archiving Servers page of the admin console. You can also set the log-related SNMP traps to capture log events during the log upload using options in the System > Log/Monitoring > SNMP page of the admin console.
To view client log upload details:
1.In the admin console, choose System > Log/Monitoring > Client Logs > Uploaded Logs management page.
Uploaded Log Listing Page shows the management page.
2.(Optional) Refresh uploaded client log details by clicking the Refresh Logs button.
3.(Optional) View or save an uploaded log by clicking on its respective link.
4.(Optional) Delete an uploaded log by clicking the trash can icon in the right side of the log's column. Note that once you delete a log from a node, those logs are lost.
Configuring SNMP
If you prefer, you can use a third-party SNMP manager, such as HP OpenView, to monitor system health. The system supports SNMP v2c and SNMPv3.
From 9.1R9 release, the system supports two users to be registered with an SNMP engine with different authentication and privilege settings.
To configure the SNMP agent:
1.Select System > Log/Monitoring.
2.Click the SNMP tab to display the SNMP configuration page.
SNMP Configuration Page - Pulse Connect Secure shows the configuration page for Pulse Connect Secure.
3.Complete the configuration as described in Table.
4.Save the configuration.
SNMP Configuration Page - Pulse Connect Secure

The following table lists the SNMP Configuration Settings:
|
Settings |
Guidelines |
||||
|
Use the Pulse Secure MIB file link to download the device management information base MIB file. You add this file to your SNMP manager configuration. |
|||||
|
SNMP Version |
Select your SNMP server version: v2c v3 |
||||
|
Agent Properties |
|||||
|
SNMP Queries |
Select to support SNMP queries. Selecting this option enables the SNMP Diagnostic Log utility in the Troubleshooting > Monitoring > Diagnostic Logs page. |
||||
|
SNMP Traps |
Select to send SNMP traps. Selecting this option enables the SNMP Diagnostic Log utility in the Troubleshooting > Monitoring > Diagnostic Logs page. |
||||
|
System Name |
Specify a system name. |
||||
|
System Location |
Specify a location. |
||||
|
System Contact |
Specify a system contact. |
||||
|
Community String |
Required only for SNMPv2c. To query the system, your network management station must send it the community string. To stop the SNMP system, clear the community field. |
||||
|
SNMPv3 Configuration |
|||||
|
Username |
Specify the SNMPv3 username. The User-Based Security Model (USM) is the default Security Module for SNMPv3. The system supports two users to be registered with an SNMP engine. Editing the SNMPv3 user attributes overwrite any already registered SNMPv3 user. The SNMPv3 user must have read-only access on all MIBs supported by the system. SNMPv3 user configuration attributes can also be used for SNMP traps. |
||||
|
Security Level |
Selection |
Auth Protocol |
Auth Password |
Priv Protocol |
Priv Password |
|
No Auth, NoPriv |
- |
- |
- |
- |
|
|
Auth, NoPriv |
Select MD5 (HMAC-MD5-96) or SHA (HMAC-SHA-96). |
Enter an authentication password. The password can contain any ASCII characters and must be at least 8 characters in length. |
- |
- |
|
|
Auth, Priv |
Select MD5 (HMAC-MD5-96) or SHA (HMAC-SHA-96). |
Enter an authentication password. The password can contain any ASCII characters and must be at least 8 characters in length. |
Select either CBC-DES or CFB-AES-128. |
Enter a privacy password. The password can contain any ASCII characters and must be at least 8 characters in length. |
|
|
Trap Thresholds |
Setting a threshold value to 0 disables that respective trap. |
||||
|
Check Frequency |
Specify the frequency in seconds for sending traps. The default is 180 seconds. |
||||
|
Log Capacity |
Specify the percent of log space used. The default is 90%. |
||||
|
Users |
Specify the percent of user capacity used. The default is 100%. |
||||
|
Physical Memory |
Specify the percent of physical memory used. The default is 0 (not reported). |
||||
|
Swap Memory (Virtual Memory) |
Specify the percent of swap memory used. The default is 0 (not reported). We recommend you monitor swap memory to alert you to potential memory issues. The threshold for traps for physical memory usage might be reached even if the system is not experiencing any difficulties. |
||||
|
Disk |
Specify the percent of disk utilization. The default is 80%. |
||||
|
CPU |
Specify the percent of CPU utilization. The default is 0 (not reported). |
||||
|
Meeting Users |
Specify the percent of meeting users. The default is 100%. |
||||
|
Optional Traps |
|||||
|
Critical Log Events |
Send traps when the system logs critical events. |
||||
|
Major Log Events |
Send traps when the system logs major events. |
||||
|
Save SNMP Settings? |
Click Save Changes to update the SNMP agent configuration. The page is refreshed and displays the SNMP engine ID. If the configuration is changed to move from SNMP v2c to SNMP v3, the system generates and displays two engine IDs. |
||||
|
SNMP Servers |
|||||
|
Hostname / IP address |
Specify the hostname or IP address for the SNMP servers to which the system will send any traps it generates. |
|
|||
|
Port |
Specify the port for the SNMP server. Typically, SNMP uses port 162. |
|
|||
|
Community (v2c) / User (v3) |
Specify the community/user string (if necessary). |
|
|||
Keep the following configuration tips in mind when you configure your SNMP manager to listen for this SNMP agent:
•Add the Pulse Secure MIB file to the SNMP manager configuration.
•If using SNMPv2c, the community string configuration for the SNMP manager and SNMP agent must match.
•If using SNMPv3, the SNMPv3 user configuration for the SNMP manager and the SNMP agent must match.
•If using SNMPv3, you must specify the Authoritative Engine ID for SNMPv3 traps that was generated when you saved the SNMP agent configuration.
The following table is a reference of MIB objects for the system. Some objects apply only to Connect Secure.
The following table lists the MIB Objects:
|
Object |
Description |
|
pulsesecure-gateway |
This file defines the private Pulse Secure MIB extensions. |
|
logFullPercent |
Returns the percentage of available file size filled by the current log as a parameter of the logNearlyFull trap. |
|
signedInWebUsers |
Returns the number of users signed in through a Web browser. |
|
signedInMailUsers |
Returns the number of users signed in through a mail. |
|
blockedIP |
Returns the IP address-blocked due to consecutive failed login attempts-sent by the iveToomanyFailedLoginAttempts trap. The system adds the blocked IP address to the blockedIPList table. |
|
authServerName |
Returns the name of an external authentication server sent by the externalAuthServerUnreachable trap. |
|
productName |
Returns the licensed product name. |
|
productVersion |
Returns the software version. |
|
fileName |
Returns the file name sent by the archiveFileTransferFailed trap. |
|
meetingUserCount |
Returns the number of concurrent meeting users sent by the meetingUserLimit trap. |
|
iveCpuUtil |
Returns the percentage of CPU used during the interval between two SNMP polls. This value is calculated by dividing the amount of CPU used by the amount of CPU available during the current and previous SNMP polls. If no previous poll is available, the calculation is based on the interval between the current poll and system boot. |
|
iveMemoryUtil |
Returns the percentage of memory utilized by the system at the time of an SNMP poll. The system calculates this value by dividing the number of used memory pages by the number of available memory pages. |
|
iveConcurrentUsers |
Returns the total number of users logged in. |
|
clusterConcurrentUsers |
Returns the total number of users logged in for the cluster. |
|
iveTotalHits |
Returns the total number of hits to the system since last reboot. It includes total values from iveFileHits, iveAppletHits, meetingHits, and iveWebHits. |
|
iveFileHits |
Returns the total number of file hits to the system since last reboot. Incremented by the Web server with each GET/POST corresponding to a file browser request. |
|
iveWebHits |
Returns the total number of hits by means of the Web interface since last reboot. Incremented by the Web server for each http request received by the system, excluding file hits, applet hits, and meeting hits. |
|
iveAppletHits |
Returns the total number of applet hits to the system since last reboot. Incremented by the Web server for each GET request for a Java applet. |
|
ivetermHits |
Returns the total number of terminal hits to the system since last reboot. |
|
iveSAMHits |
Returns the total number of SAM (Secure Application Manager) hits to the system since last reboot. |
|
iveNCHits |
Returns the total number of NC (Network Connect) hits to the system since last reboot. |
|
meetingHits |
Returns the total number of meeting hits to the system since last reboot. |
|
meetingCount |
Returns the number of concurrent meetings. |
|
logName |
Returns the name of the log (admin/user/event) for the logNearlyFull and iveLogFull traps. |
|
iveSwapUtil |
Returns the percentage of swap memory pages used by the system at the time of an SNMP poll. The system calculates this value by dividing the number of swap memory pages used, by the number of available swap memory pages. |
|
diskFullPercent |
Returns the percentage of disk space used in the system for the iveDiskNearlyFull trap. The system calculates this value by dividing the number of used disk space blocks by the number of total disk space blocks. |
|
blockedIPList |
Returns a table with the 10 most recently blocked IP addresses. The blockedIP MIB adds blocked IP addresses to this table. |
|
ipEntry |
An entry in the blockedListIP table containing a blocked IP address and its index (see IPEntry). |
|
IPEntry |
The index (ipIndex) and IP address (ipValue) for an entry in the blockedIPList table. |
|
ipIndex |
Returns the index for the blockedIPList table. |
|
ipValue |
A blocked IP address entry in the blockedIPList table. |
|
logID |
Returns the unique ID of the log message sent by the logMessageTrap trap. |
|
logType |
Returns a string sent by the logMessageTrap trap stating whether a log message is major or critical. |
|
logDescription |
Returns a string sent by the logMessageTrap trap stating whether a log message is major or critical. |
|
ocspResponderURL |
Returns the name of an OCSP responder. |
|
fanDescription |
Returns the status of the system fans. |
|
psDescription |
Returns the status of the system power supplies. |
|
raidDescription |
Returns the status of the system RAID device. |
|
iveTemperature |
Returns the temperature of MAG application blade. Other platforms such as PCS and PPS will return 0. |
|
iveVPNTunnels |
Returns the number of concurrent Pulse IPSec and NC users. |
|
iveSSLConnections |
Returns the total number of SSL connections. |
|
esapVersion |
Active ESAP version. |
|
vipChangeReason |
Reason for the VIP node change. |
|
processName |
Process name. |
|
iveTotalSignedInUsers |
Returns the total number of users logged in for the cluster. |
|
vpnACLSPercentage |
Returns the percentage of system ACL entries reached. |
|
vpnACLSCount |
Returns the number of system ACL entries reached. |
|
blockedIPv6 |
The IPv6 address that is blocked due to consecutive failed login attempts. |
|
iveNamedUsers |
The total number of Named User Licenses used for the IVE node. |
|
namedUserStorePercent |
The storage space occupied in the Named Users store. |
|
iveLogNearlyFull |
The log file (system, user access, or administrator access) specified by the logName parameter is nearly full. When this trap is sent, the logFullPercent (%of log file full) parameter is also sent. You can configure this trap to be sent at any percentage. To disable this trap, set the Log Capacity trap threshold to 0%. The trap's default value is 90%. When SNMP traps are enabled, the iveLogNearlyFull and iveLogFull traps are sent when the log files are 90% full and 100% full respectively, even if the threshold is set to 0 (disabled). |
|
iveLogFull |
The log file (system, user access, or administrator access) specified by the logName parameter is completely full. When SNMP traps are enabled, the iveLogNearlyFull and iveLogFull traps are sent when the log files are 90% full and 100% full respectively, even if the threshold is set to 0 (disabled). |
|
iveMaxConcurrentUsersSignedIn |
Maximum number or allowed concurrent users are currently signed in. You can configure this trap to be sent at any percentage. To disable this trap, set the Users trap threshold to 0%. The trap's default value is 100%. |
|
Setting the iveMaxConcurrentUsersSignedIn trap threshold to 0% only disables the threshold for the trap. The system continues to send SNMP traps generated from some other process in the system. |
|
|
iveTooManyFailedLoginAttempts |
A user with a specific IP address has too many failed sign-in attempts. Triggered when a user fails to authenticate according to the settings for the Lockout options on the Security Options tab. |
|
When the system triggers this trap, the system also triggers the blockedIP (source IP of login attempts) parameter. |
|
|
externalAuthServerUnreachable |
An external authentication server is not responding to authentication requests. When the system sends this trap, it also sends the authServerName (name of unreachable server) parameter. |
|
iveStart |
The system has just been turned on. |
|
iveShutdown |
The system has just been shut down. |
|
iveReboot |
The system has just been rebooted. |
|
archiveServerUnreachable |
The system is unable to reach the configured archive server. |
|
archiveServerLoginFailed |
The system is unable to log into the configured archive server. |
|
archiveFileTransferFailed |
The system is unable to successfully transfer files to the configured archive server. When the system sends this trap, it also sends the fileName parameter. |
|
meetingUserLimit |
Concurrent user count over license limit. |
|
iveRestart |
Supplies notification that the system has restarted according to the administrator's instruction. |
|
meetingLimit |
Concurrent meeting count over license limit. |
|
iveDiskNearlyFull |
Supplies notification that the system disk drive is nearly full. When the system sends this trap, it also sends the diskFullPercent parameter. You can configure this trap to be sent at any percentage. To disable this trap, set the Disk trap threshold to 0%. This trap's default value is 80%. |
|
iveDiskFull |
Supplies notification that the system disk drive is full. |
|
logMessageTrap |
The trap generated from a log message. When the system sends this trap, it also sends the logID, logType, and logDescription parameters. |
|
memUtilNotify |
Supplies notification that the system has met the configured threshold for memory utilization. To disable this trap, set the Physical Memory trap threshold to 0. The threshold is 0%, by default. |
|
cpuUtilNotify |
Supplies notification that the system has met the configured threshold for CPU utilization. To disable this trap, set the CPU trap threshold to 0. The threshold is 0%, by default. |
|
swapUtilNotify |
Supplies notification that the system has met the configured threshold for swap file memory utilization. To disable this trap, set the Swap Memory trap threshold to 0. The threshold is 0%, by default. |
|
ocspResponderConnectionFailed |
OCSP Responder cannot be connected. |
|
iveFanNotify |
Supplies notification that the status of the fans has changed. |
|
ivePowerSupplyNotify |
Supplies notification that the status of the power supplies has changed. |
|
iveRaidNotify |
Supplies notification that the status of the RAID device has changed. |
|
iveClusterDisableNodeTrap (clusterName,nodeList) |
Supplies the name of the cluster that contains disabled nodes, as well as a string containing the names of all disabled nodes. Node names are separated by white space in the string. |
|
iveClusterChangedVIPTrap(vipType, currentVIP, newVIP) |
Supplies the status of a virtual IP for the cluster. The vipType indicates whether the changed VIP was external or internal. The currentVIP contains the VIP prior to the change, and newVIP contains the VIP after the change. |
|
iveNetExternalInterfaceDownTrap (nicEvent) |
Supplies the type of event that brought down the external interface. The nicEvent parameter can contain values of "external" for an external event and "admin" for an administrative action. |
|
iveClusterDeleteTrap(nodeName) |
Supplies the name of the node on which the cluster delete event was initiated. |
|
iveNetInternalInterfaceDownTrap (nicEvent) |
Supplies the type of event that brought down the internal interface. The nicEvent parameter can contain values of "external" for an external event and "admin" for an administrative action. |
|
iveNetManagementInterfaceDownTrap (nicEvent) |
Supplies the type of event that brought down the management port. The nicEvent parameter can contain values of "external" for an external event and "admin" for an administrative action. |
|
iveTemperatureNotify |
IVE Temperature is above threshold. |
|
iveVIPNodeChanged |
Notifies that VIP node has changed. nodeName is the new node which is hosting the VIP. vipChangeReason specifies the reason for the change. |
|
iveProcessesNearMaxLimit |
The count of processes (by processName) is about to reach maximum limit. |
|
iveProcessesReachedMaxLimit |
The count of processes (by processName) has reached maximum limit. |
|
iveACLsNearMaxLimit |
The percentage of ACL entries has reached maximum supported limit. |
|
iveACLsCrossedMaxLimit |
The count of ACL entries has crossed maximum supported limit. |
|
iveTooManyFailedLoginAttemptsIPv6 |
Too many failed login attempts from IPv6 address. |
|
iveMaxNamedUsersSignedIn |
Maximum number of named users signed in. |
|
iveNamedUsersStoreNearlyFull |
Named user storage reached the limit. |
Configuring Syslog
If desired, you can configure the system to send logs to a syslog server.
To configure reporting to a syslog server:
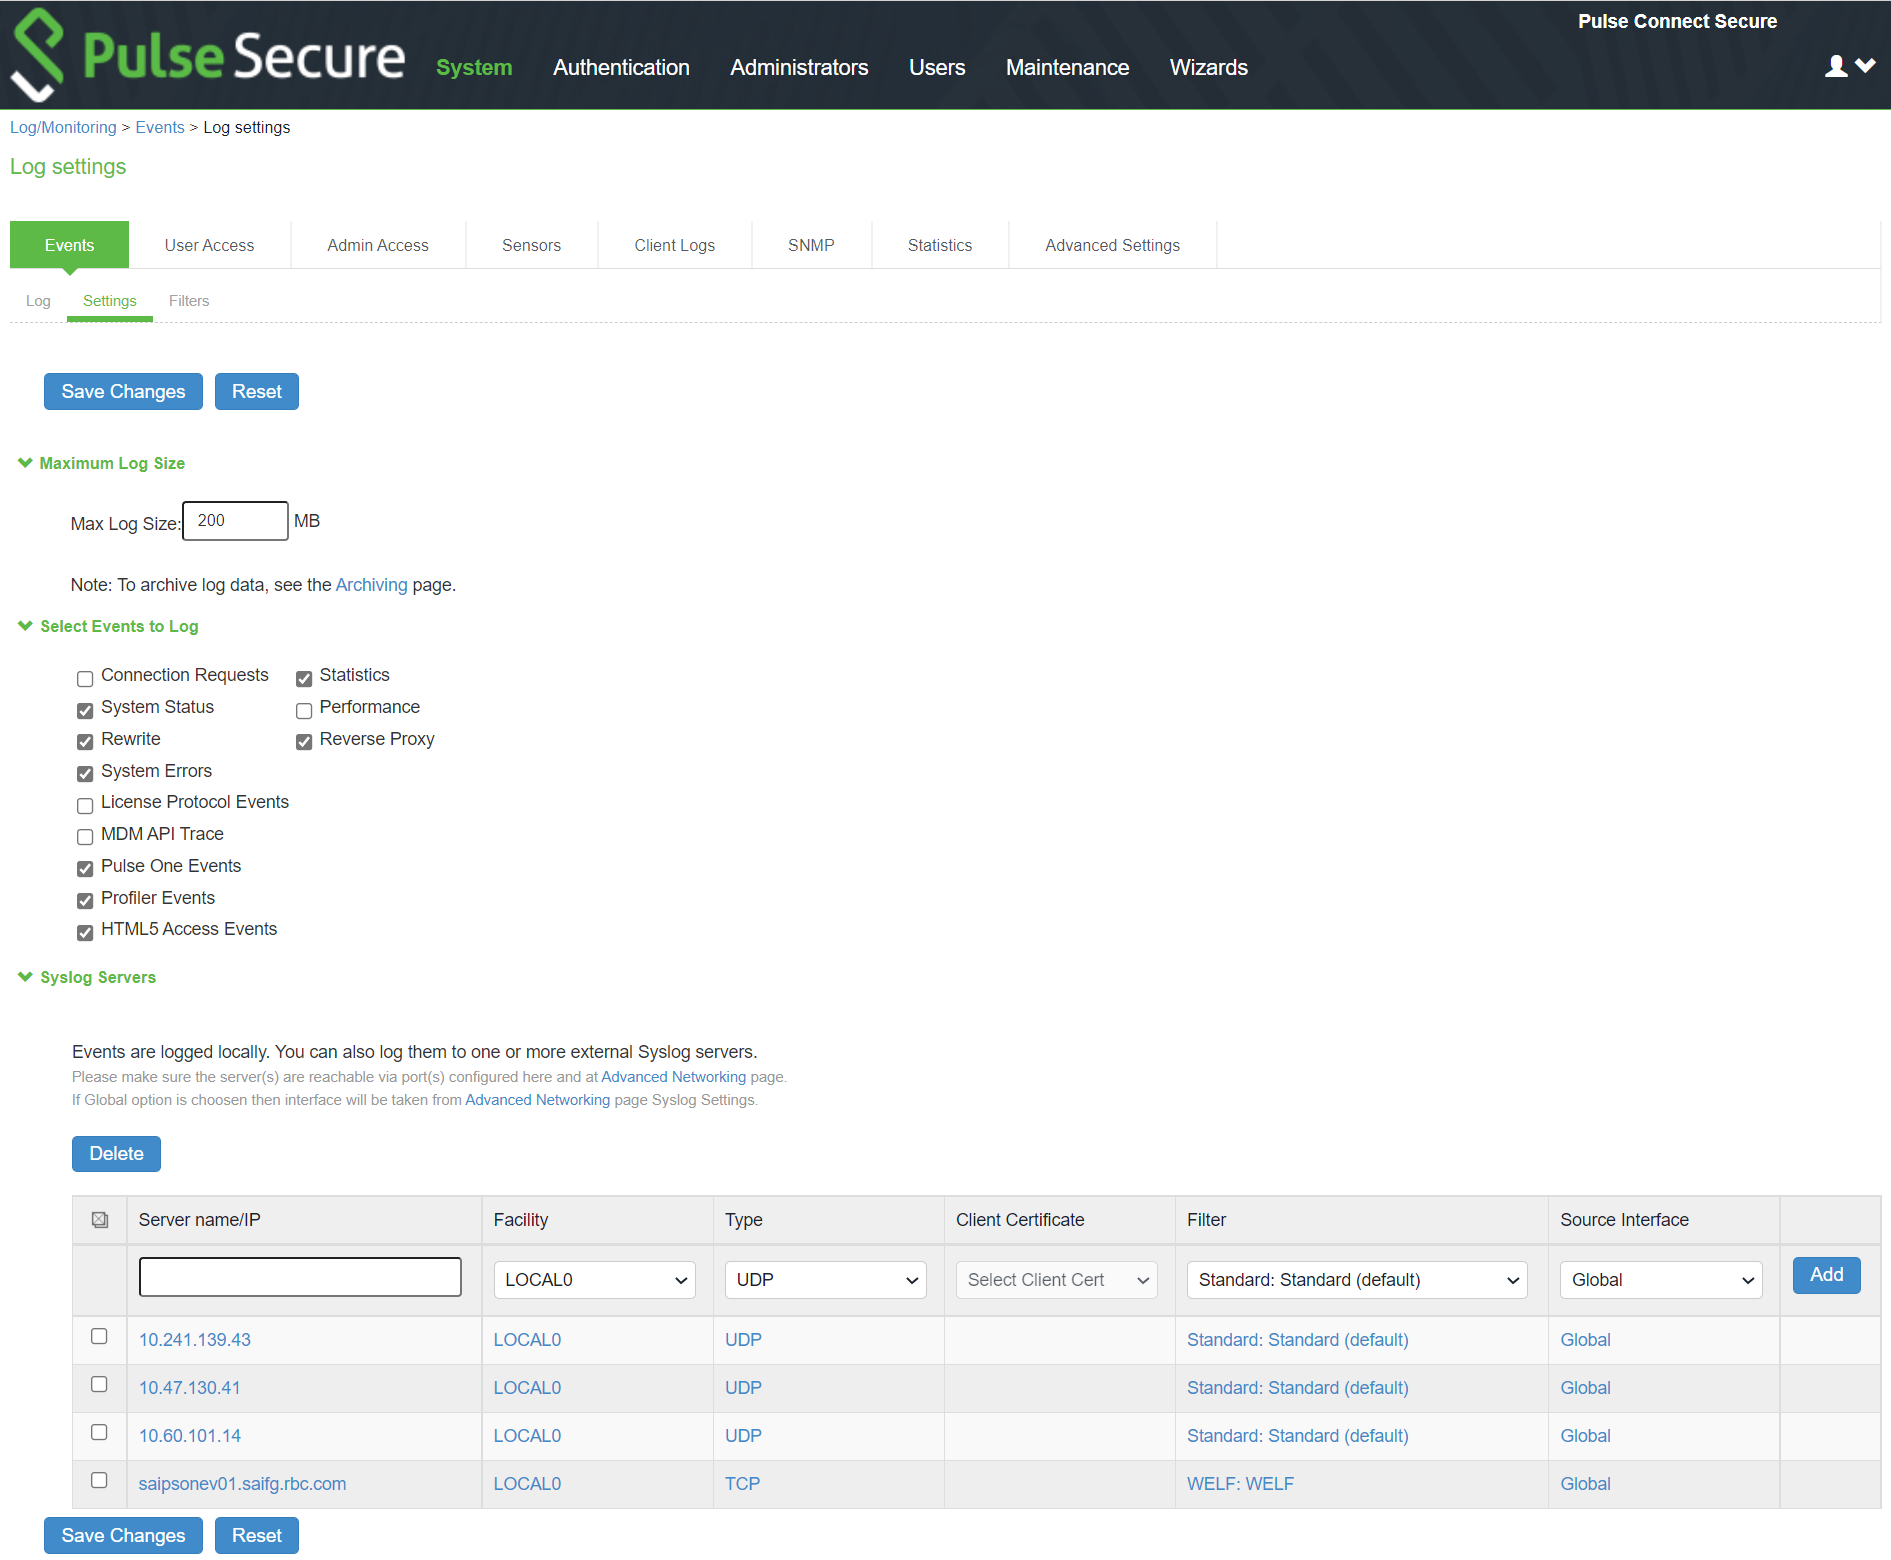
1.Select System > Log/Monitoring.
2.Click the Settings tab to display the configuration page. Syslog Server Configuration Page - Pulse Connect Secure shows the configuration page for Pulse Connect Secure. Specify the maximum log size and select the events to be logged. Specify the server configuration as described in Table and click Add. You can specify multiple syslog servers.
3.Save the configuration.
- To enable syslog reporting for each local log category, you must perform this procedure on each local log tab: Events, User Access, Admin Access, and Sensors.
- PCS|PPS sends syslogs to remote syslog server (UDP|TCP|TLS) in compliance with Syslog RFC5424 ( https://tools.ietf.org/html/rfc5424 )
Syslog Server Configuration Page - Pulse Connect Secure
The following table lists the Syslog Server Configuration Guidelines:
|
Settings |
Guidelines |
|
Specify the fully qualified domain name or IP address for the syslog server. |
|
|
If you select TLS from the Type list, the server name must match the CN in the subjectDN in the certificate obtained from the server. |
|
|
Facility |
Select a syslog server facility level (LOCAL0-LOCAL7). Your syslog server must accept messages with the following settings: facility = LOG_USER and level = LOG_INFO. |
|
Type |
Select the connection type to the syslog server. You can select: UDP (User Datagram Protocol) - A simple non-secure transport model. TCP (Transmission Control Protocol) - A core protocol of the Internet Protocol suite (IP), but lacks strong security. TLS (Transport Layer Security) - Uses cryptographic protocols to provide a secure communication. |
|
Client Certificate |
(optional) If you select TLS from the Type menu and your remote syslog server requires client certificates, select the installed client certificate to use to authenticate to the syslog server. Client certificates are defined in the Configuration > Certificates > Client Auth Certificates page. Client certificates must be installed on the device before they can be used. There is no fallback if a connection type fails. |
|
Filter |
Select a filter format. Any custom filter format and the following predefined filter formats are available: Standard (default)-This log filter format logs the date, time, node, source IP address, user, realm, event ID, and message. WELF-This customized WebTrends Enhanced Log Format (WELF) filter combines the standard WELF format with information about the system realms, roles, and messages. WELF-SRC-2.0-Access Report-This filter adds access queries to the customized WELF filter. You can use this filter with NetIQ's SRC to generate reports on user access methods. |
|
Source Interface |
Select the source port type for the syslog server: •Global •External •Internal •Management Ensure the servers are reachable through port configured in the Advanced Networking page on the Admin UI. |
Configuring Advanced Settings
This option helps to configure fault tolerance on each configured TCP and TLS syslog server available. Fault tolerance is supported only for TCP and TLS syslog servers. UDP syslog servers cannot be configured for fault-tolerance. This functionality helps the syslog server to recover the logs lost during a disconnect. The administrator can configure fault-tolerance on syslog servers by enabling this option from the admin UI. PCS/PPS reads the lost pending logs during a disconnect from the log disk and transports them to the syslog server on a reconnect. Fault tolerance is supported only for the syslog servers configured under the following log-types:
•Events
•User Access
•Admin Access
Fault tolerance is node-specific. In case of clusters, the setting needs to be enabled/disabled by logging into each of the cluster members. Fault tolerance is supported only for TCP and TLS syslog servers. UDP syslog servers cannot be configured for fault tolerance.
To configure advance settings to a TCP and TLS syslog server:
1.Select System > Log/Monitoring.
2.Click the Advance Settings tab to display the configuration page.
Log Events Settings Configuration Page shows the configuration page.
3.Complete the configuration as described in Table.
4.Save the configuration.
This feature is limited to configuring fault tolerance settings of an existing syslog server; and cannot be used to create or delete a new syslog server.
Log Events Settings Configuration Page

The following table lists the Advanced Settings:
|
Settings |
Guidelines |
|
Syslog Server |
Lists the existing Syslog servers. |
|
Type |
Specifies if the Syslog server is a TLS or TCP type. |
|
Fault Tolerance |
Tolerates the loss of network connection to a TCP/TLS syslog server for a brief period (maximum of 4 hours) by sending the logs missed during the disconnect time. Click the checkbox to enable this option. Fault-tolerance is disabled by default on any syslog server. |
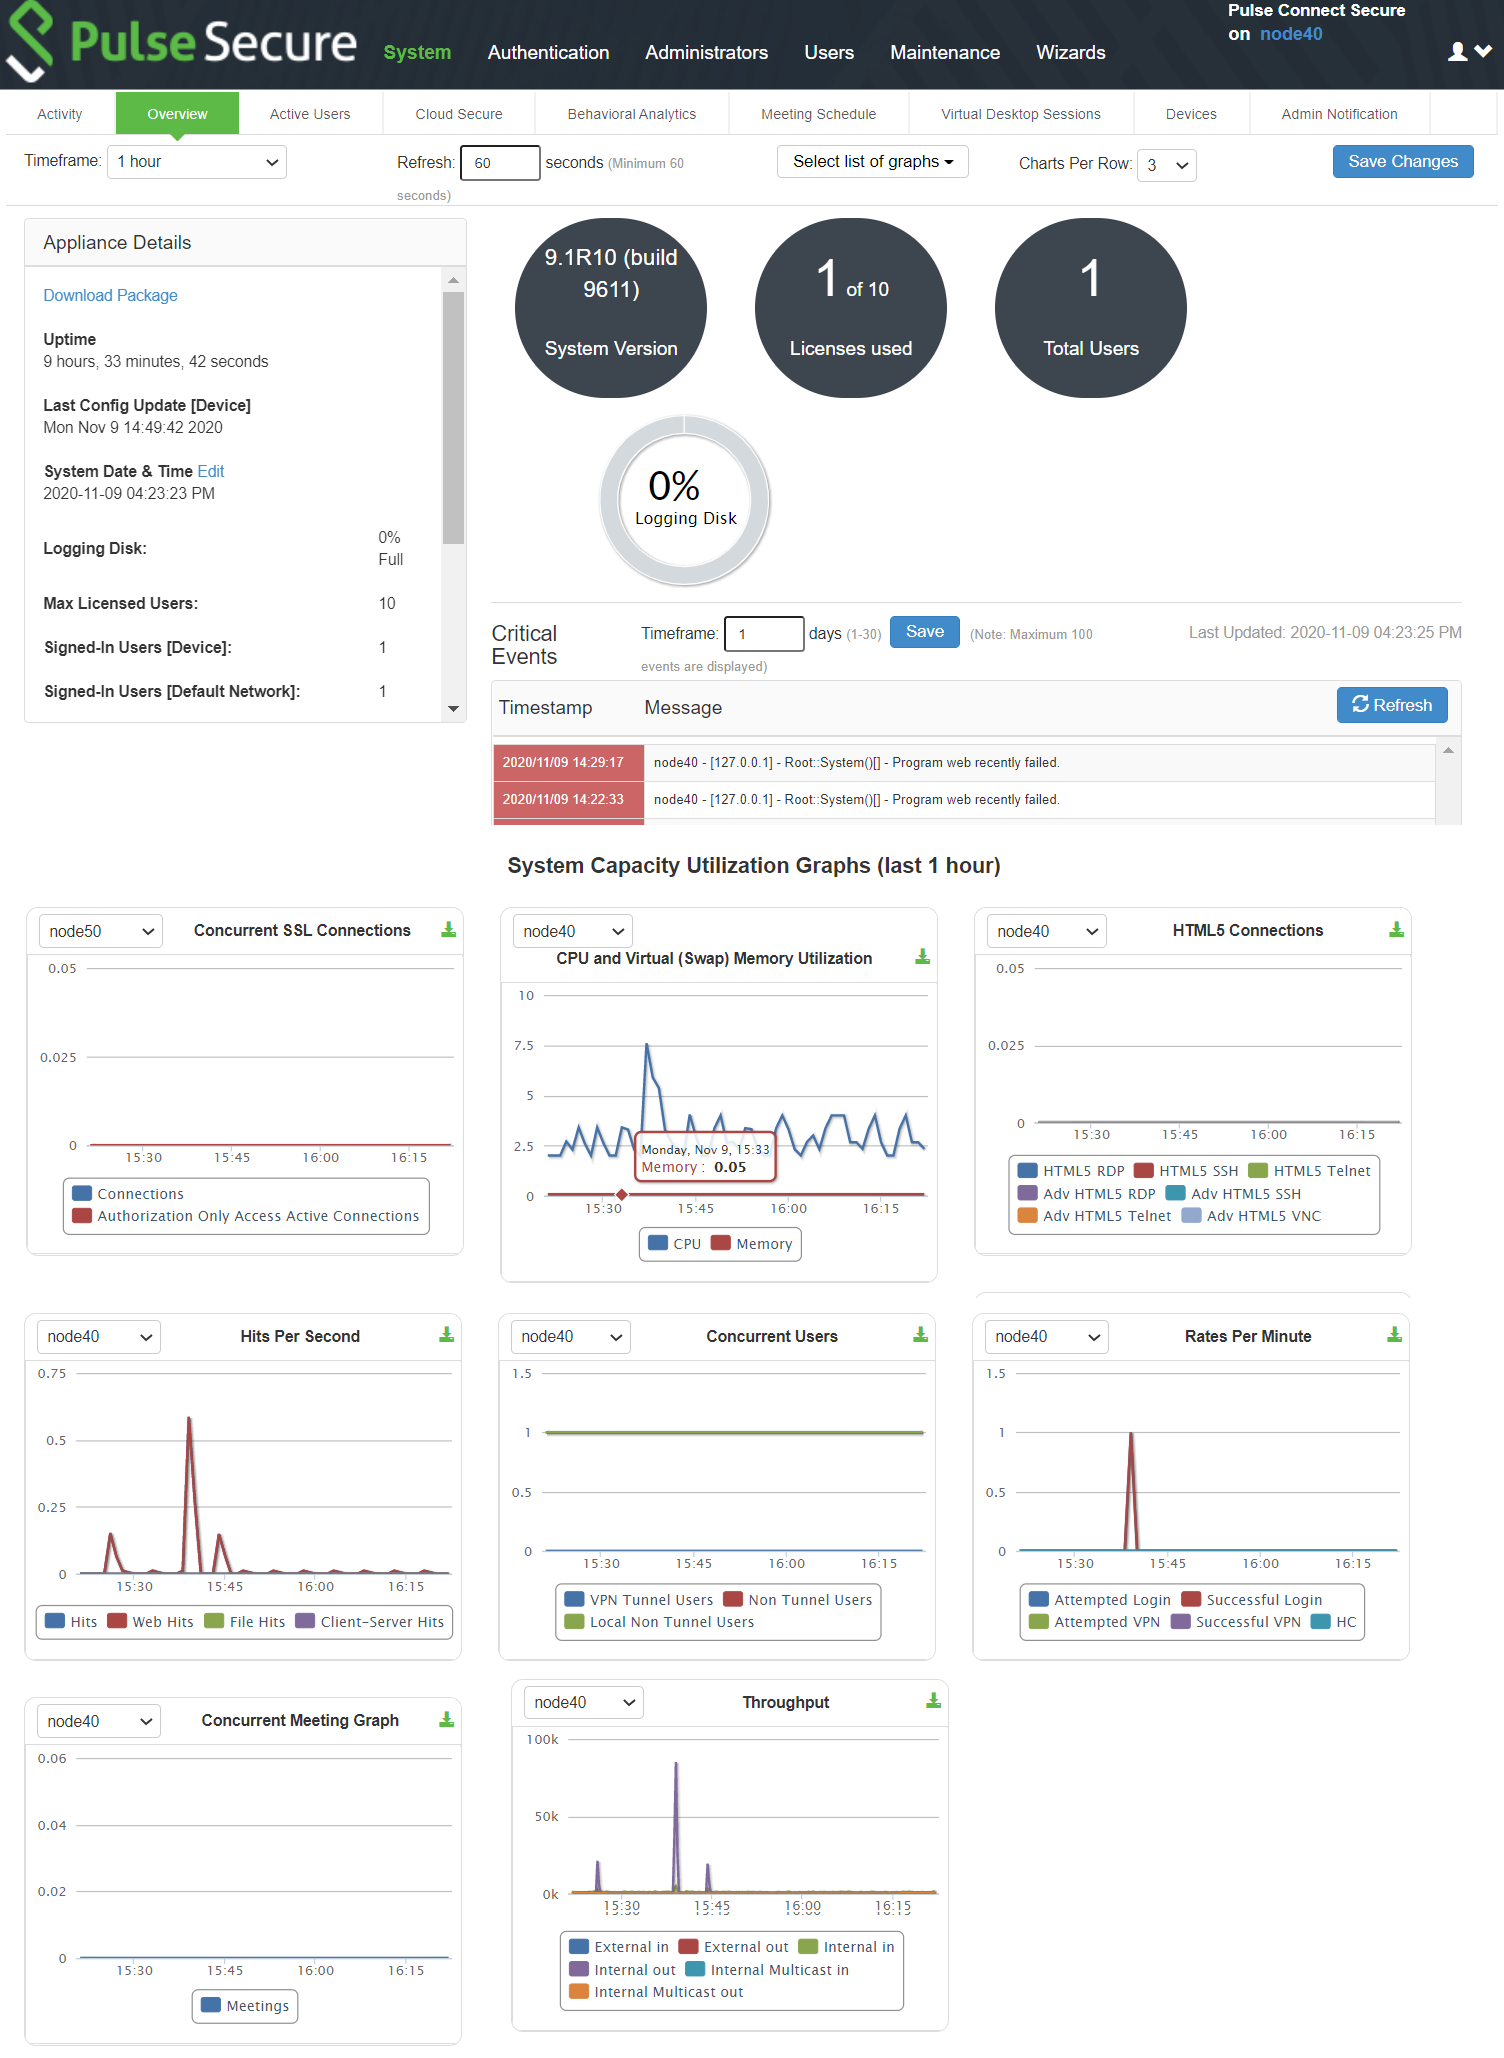
Displaying System Status
The System Status page is a dashboard of system version information, system capacity utilization, uptime, and summary user information. The System Status page is the "home" page that is displayed when you log into the admin console as an administrator. To navigate to the System Status page from other admin console pages, select System > Status.
The following figure shows the configuration page for Pulse Connect Secure. The table that follows describes the numbered figure callouts.
System Status Page - Pulse Connect Secure
|
Callout |
Description |
|
1 |
Click the Critical Events link to display a new window with a table of the last 10 critical system events. |
|
2 |
Click the Page Settings link to display a new window with the System Status Settings page shown in System Status Settings Configuration Page |
|
3 |
Click the System Version Download Package link to download the software version running on the system. You might do this when you need to synchronize software on another node to the software version running on this system. |
|
4 |
Click the System Date and Time Edit link to display the System Date and Time configuration page. See Configuring the System Date and Time. |
|
5 |
Click a System Capacity Utilization report Edit link to display a new window with controls to customize the appearance of the report graphs. |
|
6 |
Click a System Capacity Utilization report Download link to download graph data in XML format. |
|
7 |
Click an Enforcer Status link to navigate to its configuration page. |
The following table lists the Licenses and Total Users - Pulse Connect Secure:
|
Item |
Description |
|
Max Licensed Users |
Displays the maximum number of licensed users by supported platform type. |
|
Signed-In Users |
Displays the number of signed-in users. |
|
Signed-In Mail Users |
Displays the number of signed-in mail users. |
|
Concurrent Connections for Authorization only Access |
Displays the concurrent connections for authorization only access. |
|
ActiveSync Connections |
Displays the number of ActiveSync connections. |
The following figure shows the System Status Settings configuration page. The settings configuration page for Pulse Connect Secure is similar.
System Status Settings Configuration Page
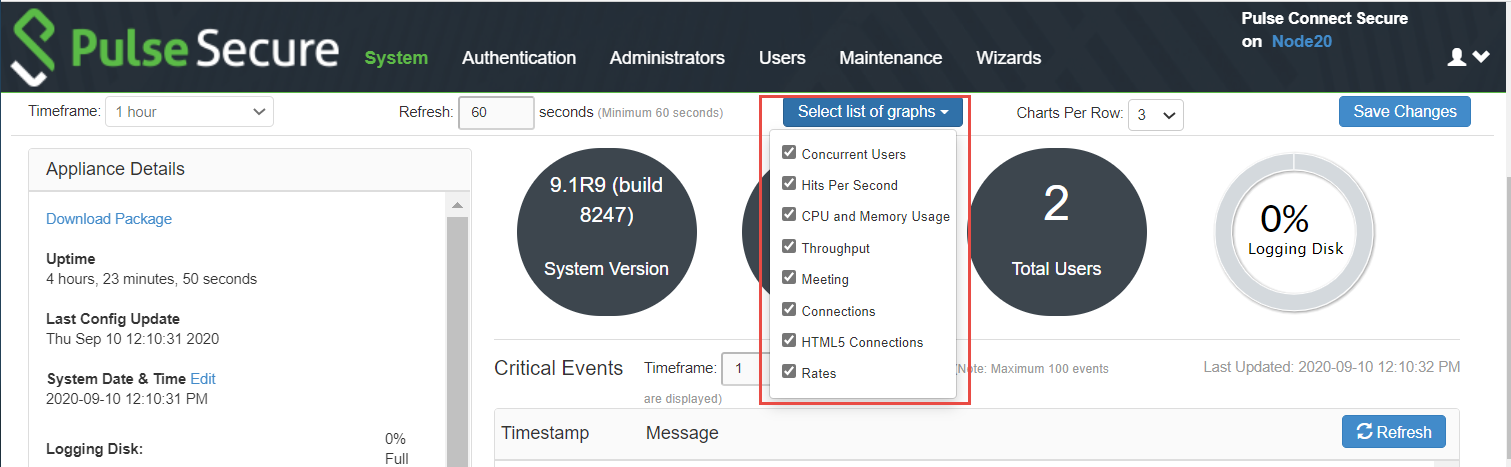
You can use this page to select the reports displayed on the System Status page, as well as data properties, such as the time dimension and refresh rate.
The following reports are available:
•Concurrent Users - Shows a count of users signed into the system. In clustered environments, the graph includes lines that display:
•the number of local users signed into the node selected from the list
•the number of concurrent users signed into the entire cluster.
•In 9.1R8, added L4 access type (PSAM) and Clientless access type (Browser) logins as non-tunnel users.
•Hits per Second - Shows a count of hits currently being processed by the system. In a clustered environment, you may select a node from the list to determine which node's data is displayed in the graph. The graph includes three lines: total number of hits, number of Web hits, and number of client/server hits.
•CPU and Memory Usage - Shows the percentage of the CPU and memory being used. In a clustered environment, you may select a node from the list to determine which node's data is displayed in the graph.
•Throughput - Shows the amount of data (in KB) being processed. In a clustered environment, you may select a node from the list to determine which node's data is displayed in the graph. The graph includes four lines: external in, external out, internal in, and internal out.
•Meetings - Shows the count of concurrent meetings. This option is available only on Connect Secure.
•Connections - Shows a count of concurrent SSL connections.
•HTML5 Connections — Shows the traffic on the HTML5 RDP, HTML5 SSH, and HTML5 Telnet connections for Basic and Advanced solution types.
•Rates - Shows the rate of attempted logins, successful logins, and Host Checker updates.
Viewing and Canceling Scheduled Meetings
You can view all of the meetings currently scheduled on Connect Secure or cancel meetings.
To view and cancel scheduled meetings:
1.Select System > Status > Meeting Schedule. The system displays real-time information about all of the meetings that are currently running or scheduled, including:
•Time and Status-Displays the time and duration that the meeting is scheduled to run, as well as the current status of the meeting.
•Meeting Details-Displays the meeting name, ID, and password requirements. This column also includes a Details link that you can use to view information about the meeting and to join the meeting.
•Meeting Role-Displays the role of the meeting creator. If the creator was signed into multiple roles when he created the meeting (that is, he is a member of multiple roles and the appliance is configured for a permissive merge).
•Attendee Roles-Displays the roles of the attendees who are signed into the meeting, the number of attendees signed into each role, and each role's meeting attendee limit. Note that non-Connect Secure attendees are displayed under the meeting creator's user role.
2.Use either of the following methods to change the meeting view (optional):
•Select a time frame (Daily, Weekly, In Progress, Scheduled) from the drop-down list to control which meetings are displayed.
•Click on any of the underlined column headers to control the order in which currently displayed meetings are sorted.
3.Click the Details link under a meeting to view information about the meeting and optionally to join the meeting (optional).
4.Choose MyMeeting URLs from the View drop menu to view personal URLs your users have created.
5.Click the delete icon in the right column to cancel a meeting or to delete a MyMeeting URL (optional).
Cancelling a meeting permanently deletes from the system. You cannot restore a meeting after cancelling it.
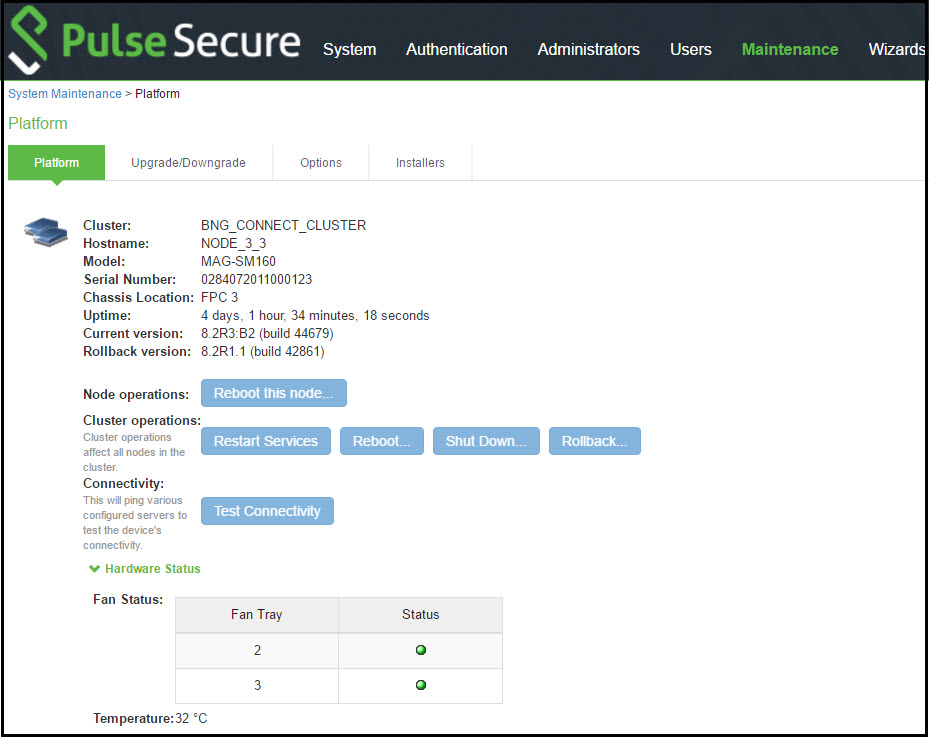
Displaying Hardware Status
You can use the Maintenance > System > Platform page to display the hardware health status, including information about hard drives, fans, and power supplies.
To display hardware health status:
Select Maintenance > System > Platform to display the System Maintenance page.
System Maintenance Page - Pulse Connect Secure shows the system maintenance page for Pulse Connect Secure.
Review the hardware status information described in Table.
System Maintenance Page - Pulse Connect Secure
The following table lists the Hardware Status Information:
|
Hardware Component |
Status Message |
|
Displays a health statement for the device disk drive. See Table 156 and Table 157 for details. |
|
|
Fan Status |
Displays a health statement for the device fan(s). |
|
Power Supply |
Displays a health statement for the device power supply. |
The following table lists the RAID status and hard drive status. Depending on your system, you may or may not see all these possible statuses.
|
RAID Status |
Drive 1 |
Drive 2 |
|
Hard Disk RAID is operational |
Active |
Active |
|
Hard Disk RAID is in single drive mode |
Missing |
Active |
|
Hard Disk RAID is in single drive mode |
Active |
Missing |
|
Hard Disk RAID has failed |
Failed |
Active |
|
Hard Disk RAID has failed |
Active |
Failed |
|
Hard Disk RAID is in the process of recovering |
Active |
Reconstructing |
|
Hard Disk RAID is in the process of recovering |
Reconstructing |
Active |
|
Hard Disk RAID is in the process of recovering |
Active |
Verifying |
|
Hard Disk RAID is in the process of recovering |
Verifying |
Active |
|
Hard Disk RAID status is unknown |
Unknown |
Active |
|
Hard Disk RAID status is unknown |
Active |
Unknown |
|
Hard Disk RAID status is unknown |
Unknown |
Unknown |
|
Not available |
n/a |
n/a |
Using Software RAID PSA7000
This section describes the use of software RAID on the PSA7000.
All hard disks are encrypted with AES128 using a random generated key.
Overview of Software RAID on the PSA7000
PSA-7000 hardwares have two hard disks but, have no hardware RAID controller. RAID functionality is enabled through the software RAID available in Linux. Software is used to create RAID devices in the RAID 1 layer. These individual disk partitions can also be used as regular partitions. All partitions, which include boot, root, data, var, tmp, swap, and so on are created out of the software RAID. Software RAID does not affect any of the other hardware models except PSA7000. It works the same way either with hardware RAID or no RAID at all.
Configuring RAID Controller on the PSA7000
To configure a RAID controller on the PSA7000, disks are hot plugged on the PSA7000. Configuring RAID on the PSA7000 also involves some manual configuration steps in the admin console. RAID configuration is carried out by the following steps:
To remove a disk from the second slot in the system
1.Select Menu option: 4. System Operations
2.Select Menu option: 20. Manage RAID
3.A prompt appears: Are you sure you want to manage RAID? (y/n)
4.Enter y for the prompt.
5.Choose Menu option: 2. Remove Disk2. This will detach the disk in the second slot from software RAID.
6.Physically unplug the disk from the second slot.
To insert a disk to the second slot in the system:
1.Physically plug in the disk in the second slot.
2.Select Menu option: 4. System Operations
3.Select Menu option: 20. Manage RAID
4.A prompt appears: Are you sure you want to manage RAID? (y/n)
5.Enter y for the prompt.
6.Choose Menu option: 4. Add Disk2. This will attach the disk in the second slot to the software RAID.
Checking RAID Statuses
To check the status of RAID and individual disks:
1.Go to system > platform page of the web interface.
Status of RAID and individual disks are displayed. The following table shows the hard disk status and the hard disk RAID status.
The following table lists the Hard Disk and Hard Disk RAID Statuses:
|
Status |
Guidelines |
|
|
Hard Disk |
Active |
A disk that is present and part of RAID |
|
Inactive |
A disk that is present but not part of RAID |
|
|
Missing |
A disk that is removed. |
|
|
Hard Disk RAID |
Operation |
Both disks are active and part of the software RAID |
|
Recovering |
Both disks are active and syncing with each other |
|
|
Failed |
Both disks are active but one of them is not part of RAID |
|
In the single drive mode, only one disk is active. The other disk is either missing or inactive.
LCD Display
This section describes the addition of LCD to PCS devices.
Overview of adding LCD for PCS
The addition of an LCD screen allows field technicians to quickly gauge the health of the system without logging into the device. The buttons on the LCD panel allow navigation through the display menus. The directional buttons are used to access the menu modes and find device information. The LCD can display two line of text. LCD with Navigation Buttons shows the LCD screen with navigation buttons.
LCD display is available for the PCS-7000 platform model only.
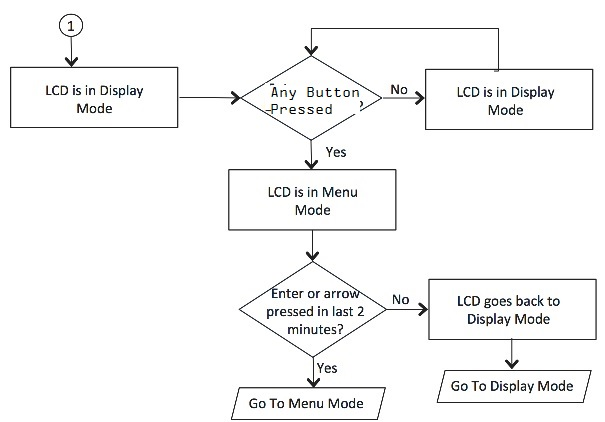
Modes Supported by the LCD
The LCD supports two modes namely the display mode (default) and the menu mode. Pressing any button in the display mode will change the mode to menu mode. If a user presses the cancel button, the LCD immediately changes back to display mode and shows the appropriate state. The LCD remains in display mode. If the LCD is in menu mode and the user does not press any button for more than two minutes, then the LCD changes back to display mode. Two Modes Supported by the LCD shows the two modes supported by the LCD
Two Modes Supported by the LCD
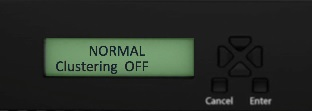
Display Mode
The display mode describes the current state of the system, such as normal state or error conditions (e.g., fan speed and overheat). It represents the default status. The LCD goes into display mode after boot-up is complete. In display mode, the LCD is either set to NORMAL or shows a label that describes an error condition. If all systems are functioning normally, then the LCD shows NORMAL. The second line in the NORMAL state is used to show whether the appliance is configured as part of a cluster. The valid states in the display mode are Clustering OFF and Clustering ON. Valid States in Display Mode shows the two valid states in display mode.

Detecting Error Conditions in Display Mode
If more than one error condition is detected, all error conditions will be displayed in sequence with a 2 second pause before switching to the next one. All error conditions need to be cleared before the status returns back to the NORMAL state. Error conditions include:
•Overheat
•Fan Failure
•RAID Errors
Error Conditions shows the various error conditions that are detected.
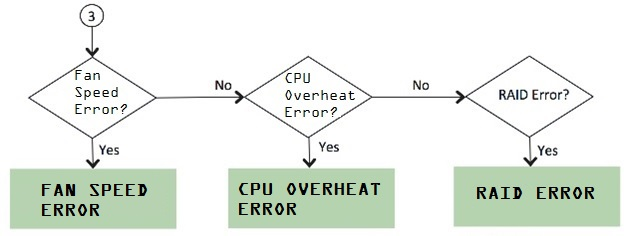
To detect the error conditions in the display mode:
If there are any error conditions, they are automatically shown on the LCD screen when it is in the display mode. The types of errors displayed are: Fan Failures, CPU overheating and RAID errors. If there are multiple errors, they would be displayed in the order shown in Error Conditions with a two second pause between successive displays.
xZZZcx cmcc nxncxncxxxxxkxkkv;dkdkkm The error message is automatically cleared when the underlying error condition is resolved. For example: the CPU overheat message disappears when CPU temperature is lowered. The user can enter the Menu mode at any point, even if an error message is being displayed.
Menu Mode
The menu mode is activated when the user presses any button. A single press of the button changes to menu mode and loads the last selected menu selection.
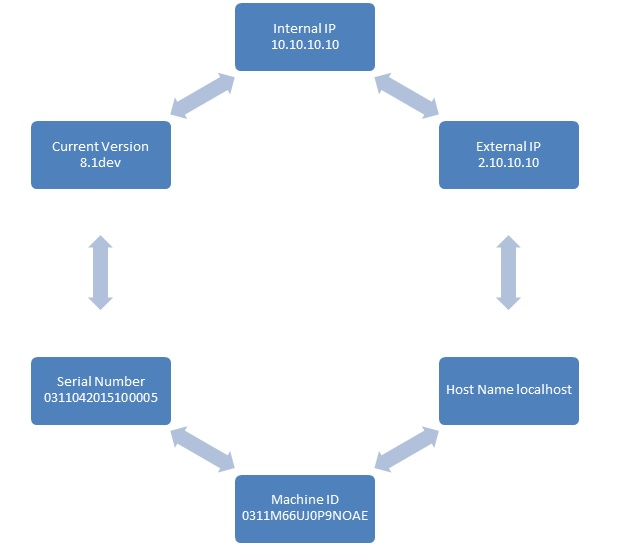
To view information in the menu mode:
1.Press any button. This puts the LCD into menu mode.
2.Press the right and left arrows keys to obtain the available system configuration data.
3.View information starting with the Internal IP and moving in a clockwise direction.
4.The menu screens loop back in a cycle.
5.Press Cancel at any point to exit to display mode.
Any button, even cancel will put the user in the menu mode.
System Configuration Data Available in Menu Mode show the available system configuration data available in menu mode.
System Configuration Data Available in Menu Mode
Displaying Active Users
You can use the Active Users page to display the system active users table and to perform administrative actions pertaining to active sessions.
The system active users table displays all users who have an active session (in contrast to the user's tables that appear on the authentication server configuration pages, which display session records for active and inactive sessions that were authenticated by the particular authentication server).
If a user signs in and is placed in a VLAN without an IP address, the table does not display an IP address under Signed in IP.
If there is a NAT device between the user's computer and the Infranet Enforcer, the table displays both the NAT device's IP address and the endpoint's virtual source IP address under Signed in IP. For example, if the NAT device's IP address is 10.64.9.26, and the endpoint's virtual source IP address is 192.168.80.128, the following information is displayed under Signed in IP: 10.64.9.26 (192.168.80.128 behind NAT).
To display the system Active Users page:
1.Select System > Status.
2.Click the Active Users tab to display the system active users page.
3.Use the controls described in the following table to perform administrative actions pertaining to active sessions.
The following table lists the Active Users Page:
|
Buttons |
Administrative Actions |
|
Refresh records displayed on the page: To refresh the page, click Update. To display a specific user, enter the username in the Show Users Named box and click Update. If you do not know the exact username, use the asterisks (*) as a wildcard character. To change the table size, enter a number in the Show N users' box and click Update. To sort the table of currently signed-in users and administrators, click a column header. |
|
|
Delete Session |
Select the check box next to the appropriate names and then click Delete Session to immediately delete the session. The user is signed out by your action. |
|
Delete All Sessions |
Use this option to immediately delete all sessions. Users are signed out by your action. If you want to sign out administrators, you must choose them individually and use the Delete Session button. |
|
Refresh Roles |
Manually evaluate all authentication policies, role-mapping rules, role restrictions, user roles, and resource policies for all currently signed-in users. Use this button if you make changes to an authentication policy, role-mapping rules, role restrictions, or resource policies and you want to immediately refresh the roles of all users. |
Displaying System Logs
This topic describes how to display local system logs.
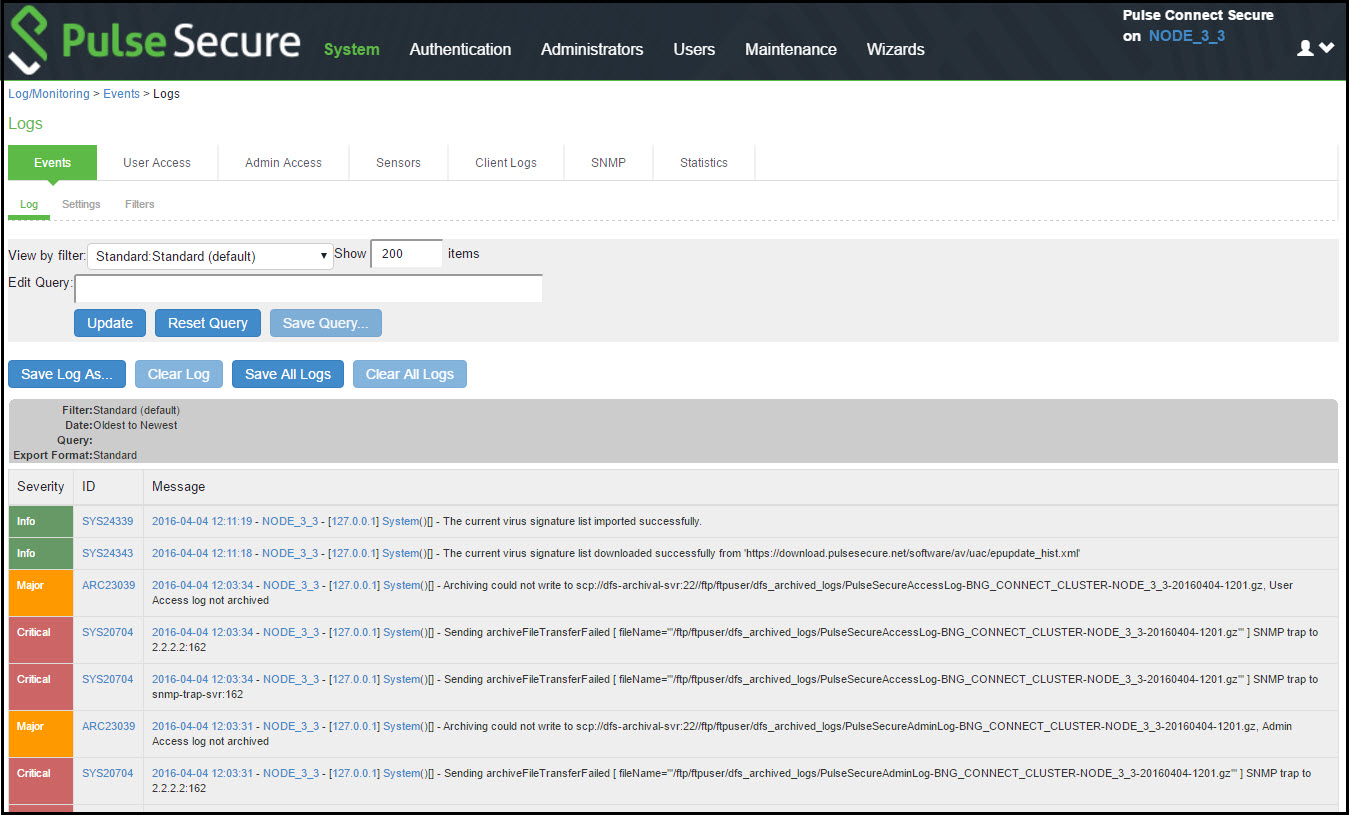
Displaying Events Logs
The Events logs include system events, such as session timeouts, system errors and warnings, requests to check server connectivity, and system restart notifications. The local log viewer displays the most recent 5000 log messages (the display limit).
To display Events logs:
1.Sselect System Log/Monitoring.
2.Click the Events tab.
3.Click the Log tab to display the log page.
Events Logs Page - Pulse Connect Secure shows the log page for Pulse Connect Secure.
4.Use the features described in Table to examine log records or manage the log collection.
Events Logs Page - Pulse Connect Secure
The following table lists the Log Management Features:
|
Controls |
Description |
|
Select a filter format. Any custom filter formats and the following predefined filter formats are available: Standard (default)-This log filter format logs the date, time, node, source IP address, user, realm, event ID, and message. WELF-This customized WebTrends Enhanced Log Format (WELF) filter combines the standard WELF format with information about the system realms, roles, and messages. WELF-SRC-2.0-Access Report-This filter adds access queries to the customized WELF filter. You can use this filter with NetIQ's SRC to generate reports on user access methods. Format filters change only the data displayed (or columns exported), and do not affect the log data that has been collected. |
|
|
Query |
In the log display, several fields are hyperlinks. The hyperlinks function as dynamic queries on the local log collection. For example, if you click the log ID, the date, or an IP address or username, the log viewer queries the log collection for records that match the value you clicked, and redisplays the log collection. You can apply additional query filters by clicking additional hyperlinked values, essentially creating a Boolean AND query (for example, date AND IP address). Use the Reset Query button to clear the query filters and redisplay the unfiltered log collection. Use the Save Query button to save the dynamic log query as a custom filter. When you click the Save Query button, the system displays the Filters tab displays with the Query field prepopulated with the variables you selected from the log. Query filters change only the display (or rows exported), and do not affect the log data that has been collected. |
|
Save Log As |
Save the local log collection to a file. We recommend you retain the system generated log name, which follows a consistent convention: juniper.logtype.nodename.log. The local log viewer displays the most recent 5000 log messages (the display limit). If the current log file contains fewer than 5000 log messages, older log messages from the backup log file are displayed, up to a total of 5000 log messages. This makes the log files appear as one, even though they are stored separately. When you save the log messages or use the FTP archive function, the backup log file is appended to the current log file, and is then downloaded as one log file. If the log files are not archived or saved by the time they are rolled over again, the oldest log messages (saved in the backup log file) are lost. |
|
Clear Log |
Clear the local log and log.old file. When you clear the local log, events recorded by the syslog server are not affected. Subsequent events are recorded in a new local log file. |
|
Save All Logs |
The Save All Logs button appears on the Events, User Access, Admin Access, and Sensors tabs. When you click Save All Logs, the system generates a file that includes event, user access, admin access, sensor logs, and XML data for all of the system statistics and graphs shown on the Status > Overview page. After you click Save All Logs, you are prompted to download a file named pulsesecurelogs-graphs.tar.gz to your local host. |
|
Clear All Logs |
The Clear All Logs button appears on the Events, User Access, Admin Access, and Sensors tabs. It clears event, user access, admin access, sensor logs, and XML data for all of the system statistics and graphs shown on the Status > Overview page. When you clear the local log, events recorded by the syslog server are not affected. Subsequent events are recorded in a new local log file. |
Displaying User Access Logs
The User Access logs include information about user access, such as the number of simultaneous users at each one-hour interval (logged on the hour) and user sign-ins and sign-outs. The local log viewer displays the most recent 5000 log messages (the display limit).
To display User Access logs:
1.Select System > Log/Monitoring.
2.Click the User Access tab.
3.Click the Log tab.
4.Use the features described in Table to examine log records or manage the log collection.
Displaying Admin Access Logs
The Admin Access logs include information about administrator actions, such as administrator changes to user, system, and network settings. It includes a log entry whenever an administrator signs in, signs out, or changes licenses on the appliance. The local log viewer displays the most recent 5000 log messages (the display limit).
To display Admin Access logs:
1.Select System Log/Monitoring.
2.Click the Admin Access tab.
3.Click the Log tab.
4.Use the features described in Table to examine log records or manage the log collection.
Displaying Sensor Logs
The Sensor logs include information related to communication with an IDP sensor if you have deployed a coordinated threat control solution. The local log viewer displays the most recent 5000 log messages (the display limit).
To display Sensor logs:
1.Select System > Log/Monitoring.
2.Click the Sensor tab.
3.Click the Log tab.
4.Use the features described in Table to examine log records or manage the log collection.
Using Log Filters
This topic describes how to use log filters.
Reviewing the Configuration of Predefined Log Format Filters
To view the configuration of predefined log format filters:
1.Select System > Log/Monitoring.
2.Click the Events tab.
3.Click the Filter tab to display the log filters page.
Log Filters Page - Pulse Connect Secure shows the log filters page for Pulse Connect Secure.
4.Click the hyperlinked name of the filter to display its configuration page. You cannot edit the predefined filter named Standard, but you may edit the predefined WELF filters and any other custom filters that appear in the list.
Log Filters Page - Pulse Connect Secure

Creating a Custom Log Collection Filter
If desired, you can create custom log collection filters to change the records displayed or exported. For example, it is common to see administrators use a filter for RADIUS accounting logs. This filter allows only the accounting log message, and it puts the entire message in a comma separated list. The order of the filtered message is: Date, Time, User, Realm, "List of Roles", NAS-ID, Acct-Status, Auth-Type, Attr-Value1, Attr-Value2, Attr-Value3.
Accounting attribute messages are different from authentication attribute messages in that the attribute name is not printed in the log message, but a comma is inserted for every attribute to be logged, even if it is not present.
To create a custom log collection filter:
1.Select System >Log/Monitoring.
2.Click the Events tab.
3.Click the Filter tab.
4.Click New Filter to display the configuration page. New Filter Page - Pulse Connect Secure shows the configuration page for Pulse Connect Secure.
5.Complete the configuration as described in Table.
6.Save the configuration.
New Filter Page - Pulse Connect Secure
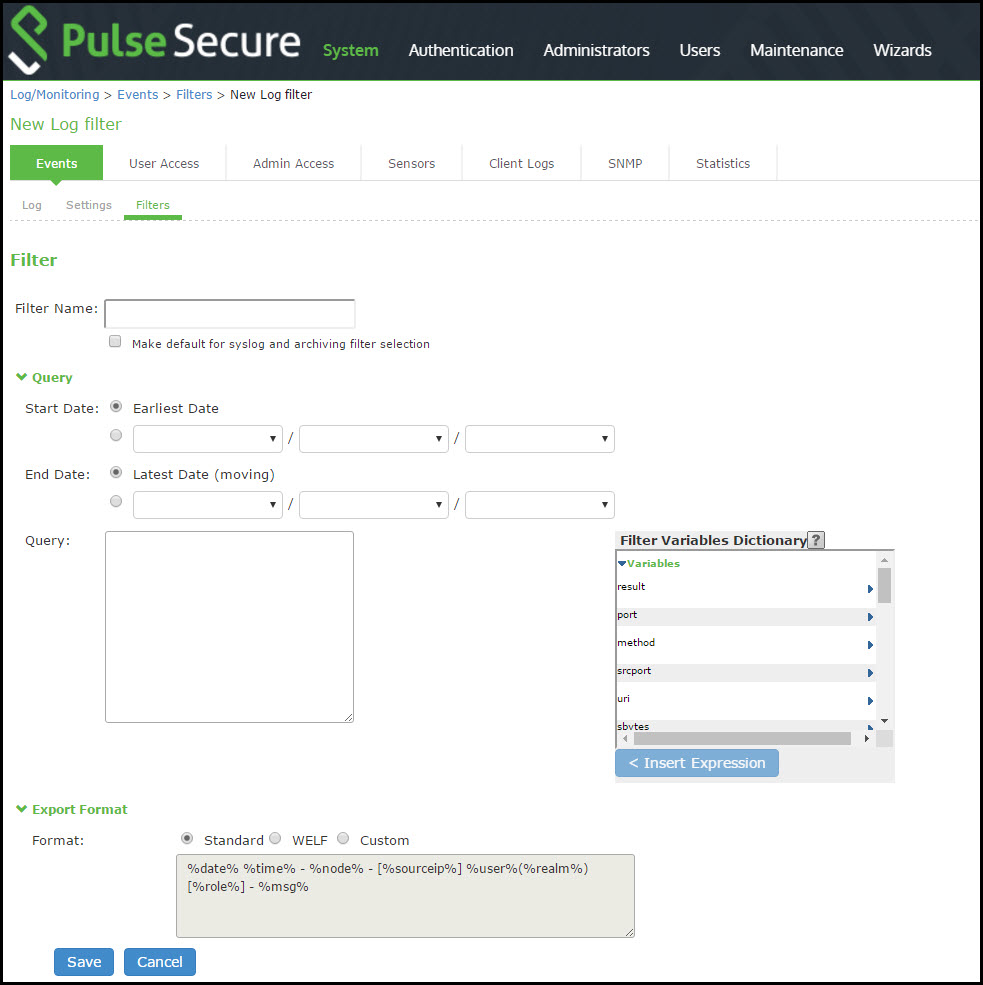
The following table lists the Filter Settings:
|
Settings |
Guidelines |
|
Specify a name that is helpful to you and other administrators in understanding usage for your custom filter. |
|
|
Make default |
Make the filter the default on syslog and archiving configuration pages. |
|
Query |
|
|
Start Date |
Enter a start date. Click Earliest Date to write all logs from the first available date stored in the log file. |
|
End Date |
Enter an end date. Click Latest Date to write all logs up to the last available date stored in the log file. |
|
Query |
Use the Filter Variables Dictionary to insert query expressions in the Query box. Enclose the query value in single quotes. For example, insert the query expression sourceip=. Then complete the expression by adding the value '192.168.0.1'. |
|
|
|
|
Export Format |
Select an export format: Standard (default)-This log filter format logs the date, time, node, source IP address, user, realm, and message. WELF-This customized WebTrends Enhanced Log Format (WELF) filter combines the standard WELF format with information about the system realms, roles, and messages. Custom-Use the Standard as a template for your custom selection of columns to be included in exports (when log collections are saved to files). |
|
|
|
|
|
|
|
|
|
Log query filters change only the data displayed (or rows exported). Log format filters change only the data displayed (or columns exported). Use of filters does not affect the log data that has been collected.
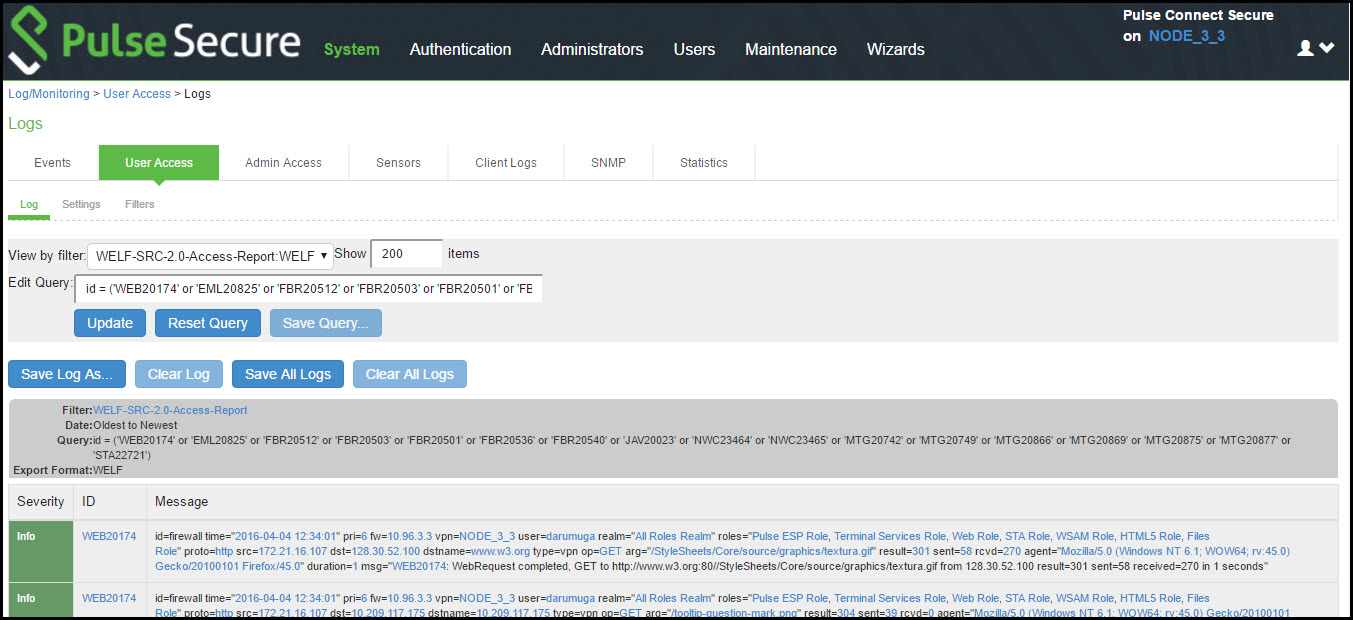
Example: Using the Source IP Address Filter
When drilling into logs to verify behavior or troubleshoot an issue with a dual-stack device, it is helpful to redisplay the log collection filtered on the IP address.
To filter on an IP address:
1.Select System > Log/Monitoring.
2.Create the filter:
1.Select User Access and then Filter.
2.Define the filter expression, name the filter, and click Save. In this example, we create a filter based on source IP address and name it IPv6_Address_Filter:Standard.
3.Use the filter:
1.Select Logs to display the user logs table.
2.Under View by filter, select IPv6_Address_Filter:Standard, as shown in Using IP Address Filters.
3.If desired, under Edit Query, edit the value of the sourceip= variable expression to filter on different source IP addresses.
4.Click Update to apply the filter and redisplay the log collection.
Displaying User Access Statistics
Every hour, the system logs the peak count of Web users in the previous hour. It displays the hourly counts for the past week on the Statistics page. It writes the report to the system log once a week.
To display user statistics:
1.In the admin console, select System > Log/Monitoring.
2.Click the Statistics tab to display the page.
User Statistics Page - Pulse Connect Secure shows the configuration page for Pulse Connect Secure.
3.Scroll the page to view the data.
User Statistics Page - Pulse Connect Secure
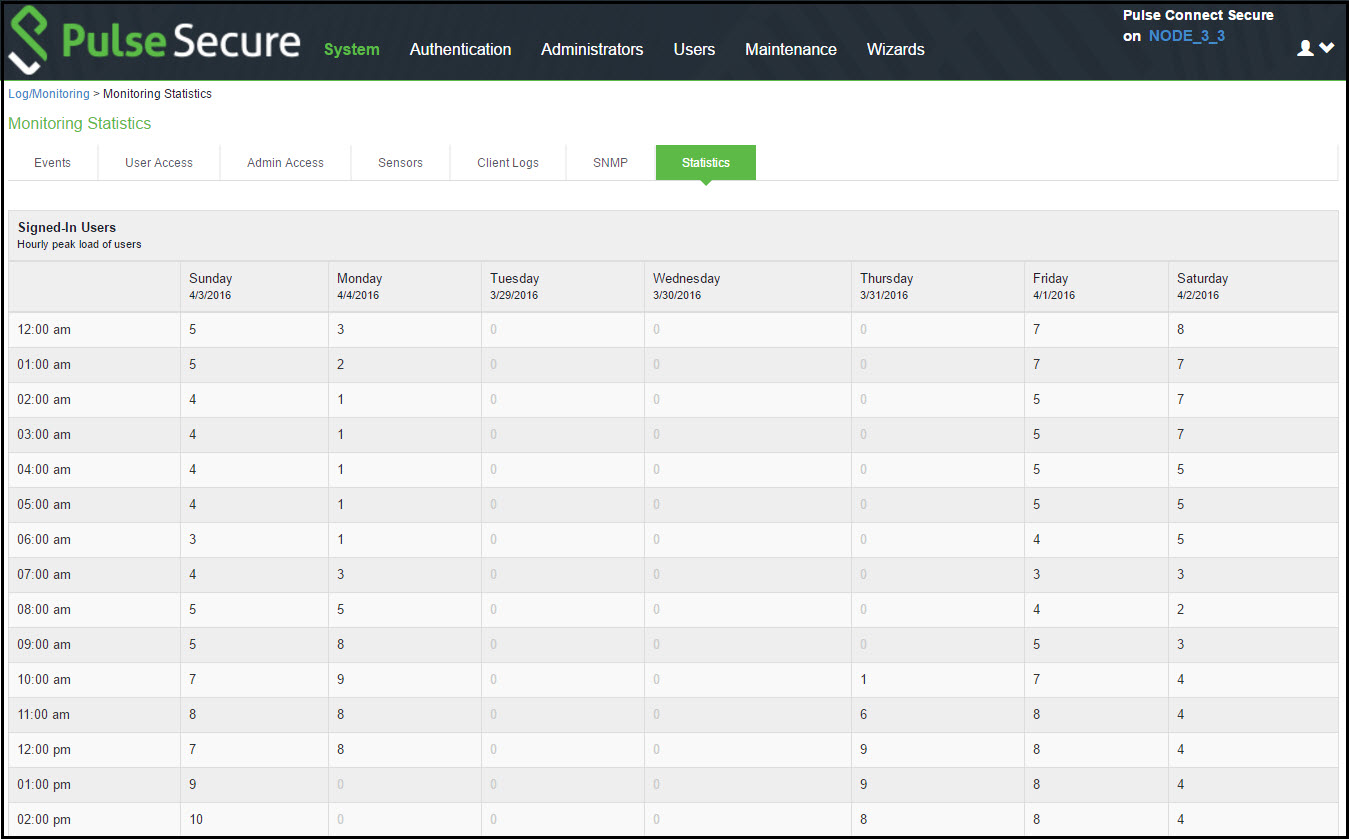
4.Upgrading software clears all statistics. If you configure the system to log statistics hourly, however, older statistics are still available in the log file after an upgrade.