Configuring Splunk
Install Pulse Policy Secure Syslog Add-On for Splunk
Download the TA_pulse_policy_secure_syslog_addon_1.0.0.tar.gz file from Pulse Secure software downloads location and install them onto your Splunk server.
To configure the Pulse Policy Secure syslog Add-On:
1.Log into Splunk as an Admin user.
2.In the Splunk Enterprise Dashboard, select the Admin tab > Manage Apps.
3.Select Apps > Upload App.
4.Click Browse and upload the TA_pulse_policy_secure_syslog_addon_1.0.0.tar.gz file to install the Pulse Secure Syslog Add-On for Splunk.
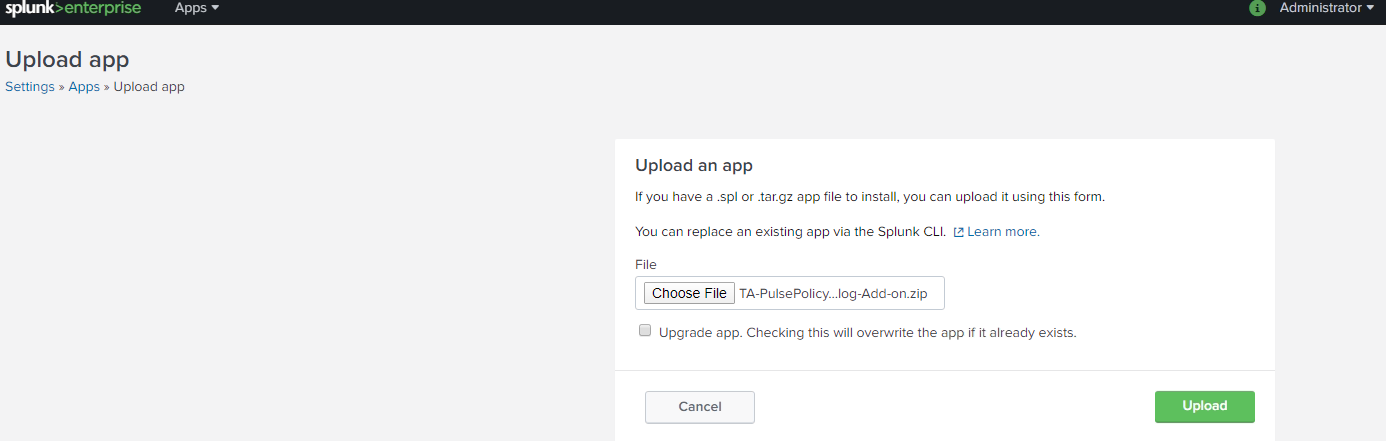
For upgrading the existing Pulse Policy Secure app, select the upgrade app. Checking this will overwrite the app if already exists option.
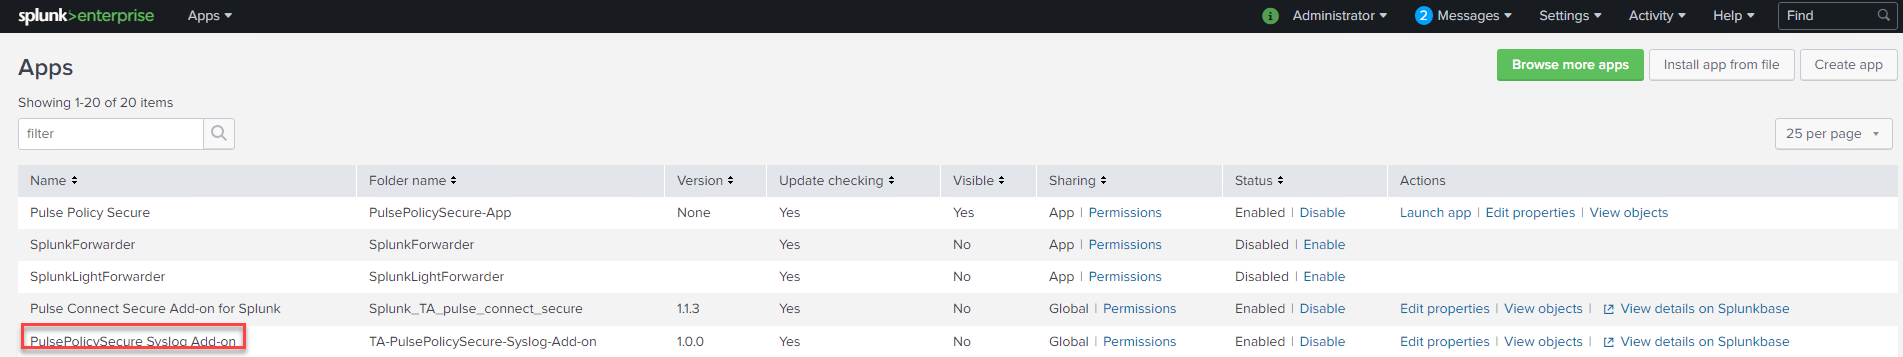
5.After installation, PulsePolicySecure Syslog-Add-On for Splunk appears in the App section with Splunk App version 1.0.0.
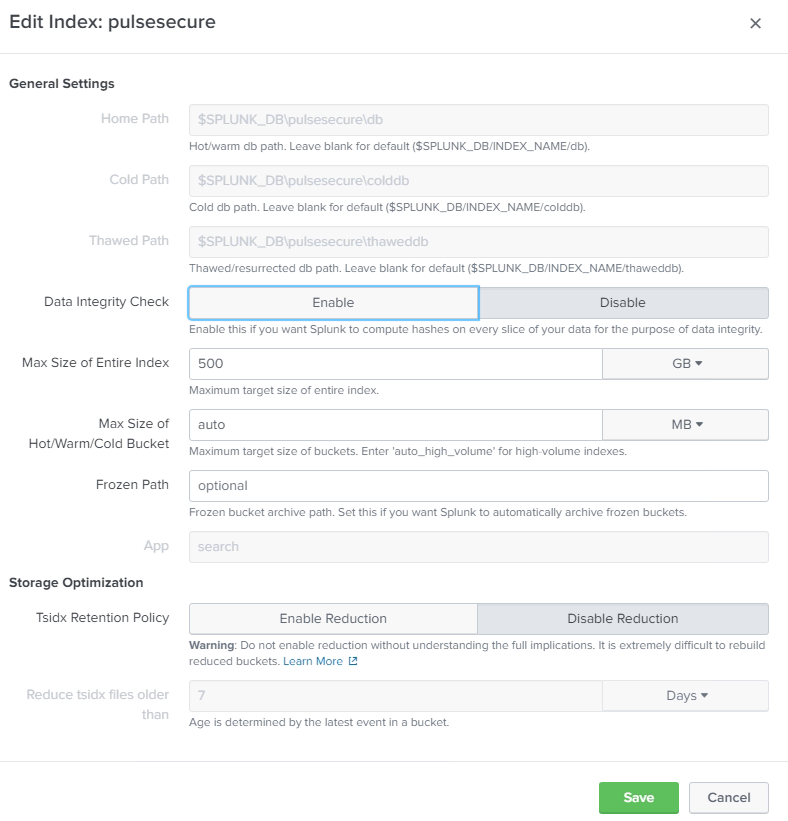
Create an index
Indexing is a mechanism to speed up the search process by giving numeric addresses to the piece of data being searched. We can create a new index with desired size by the data that is stored in Splunk. The additional data that comes in can use this newly created index with better search functionality.
To create an index:
1.Select Settings > Indexes > New Index.
2.Create a new Index. For example, pulsesecure.
Search Index
To see the data logged by Pulse Policy Secure:
1.Under App: Search & Reporting, select the Search tab.
2.Select the Time from the drop down.
3.Enter the index query. For example, index=pulsesecure sourcetype=ppssyslogportparser. You can select multiple PPS IP address/host name for querying from multiple PPS servers.
4.Press Enter.
Example 1: Sample Query for Admission Control
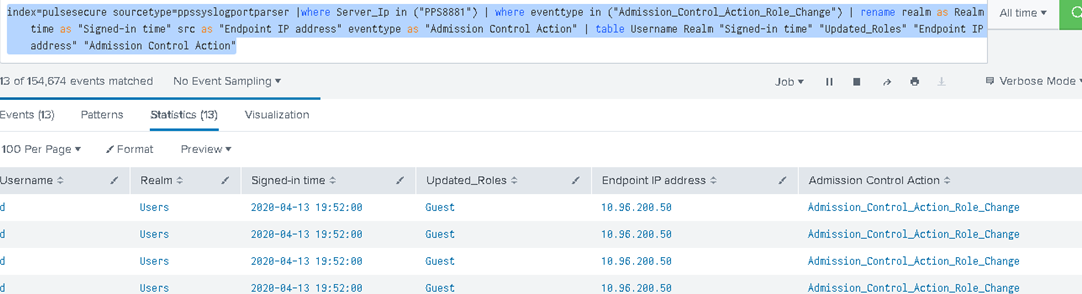
This sample query displays all the events from Pulse Policy Secure for Admission Control role change based on the selected time frame. You can customize the Splunk search query as per your requirement. For example, src field from the sylog can be changed to Endpoint IP address.
index=pulsesecure sourcetype=ppssyslogportparser |where Server_Ip in ("PPS8881") | where eventtype in ("Admission_Control_Action_Role_Change") | rename realm as Realm time as "Signed-in time" src as "Endpoint IP address" eventtype as "Admission Control Action" | table Username Realm "Signed-in time" "Updated_Roles" "Endpoint IP address" "Admission Control Action"
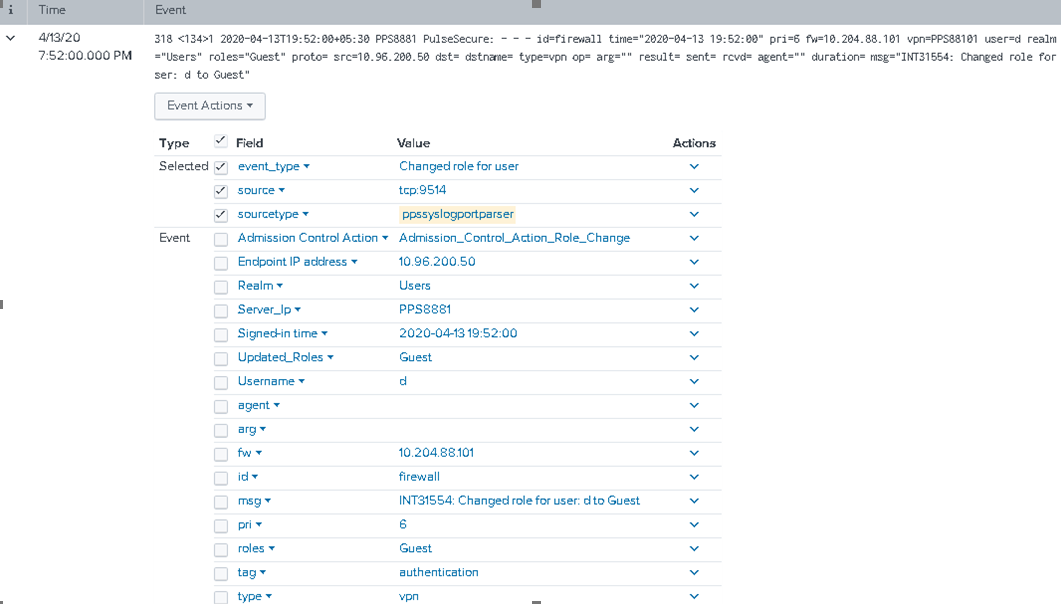
You can click the down arrow to view the role change events and additional fields from syslog data.
Example 2: Pulse Login Query for L3 agent login
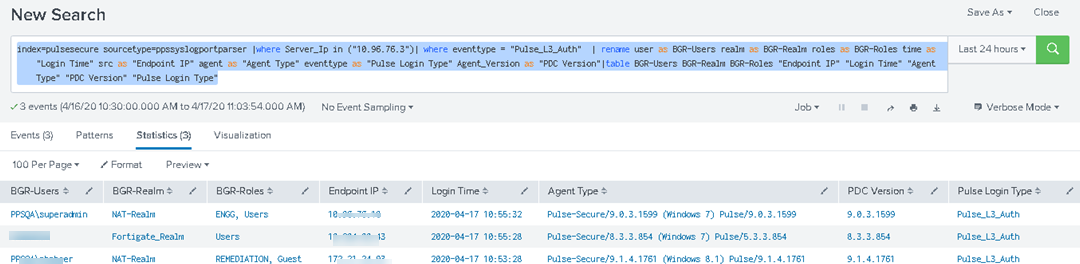
This sample query displays all the events from Pulse Policy Secure for user login using Pulse Client.
index=pulsesecure sourcetype=ppssyslogportparser |where Server_Ip in ("10.xx.xx.xx")| where eventtype = "Pulse_L3_Auth" | rename user as BGR-Users realm as BGR-Realm roles as BGR-Roles time as "Login Time" src as "Endpoint IP" agent as "Agent Type" eventtype as "Pulse Login Type" Agent_Version as "PDC Version"|table BGR-Users BGR-Realm BGR-Roles "Endpoint IP" "Login Time" "Agent Type" "PDC Version" "Pulse Login Type"
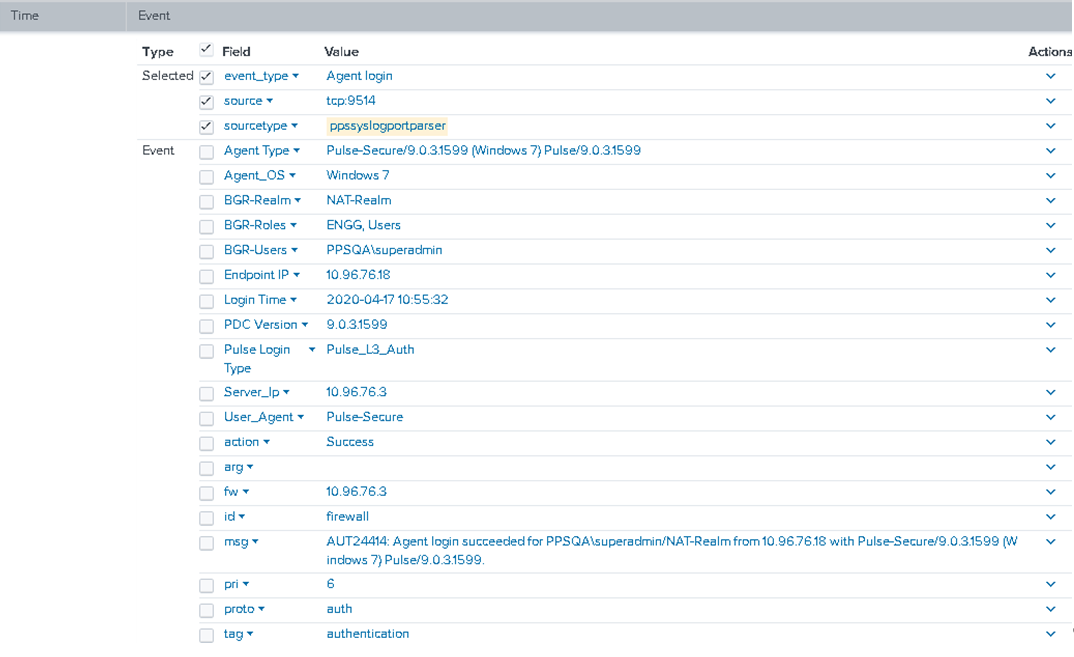
You can click the down arrow to view the event extract details.
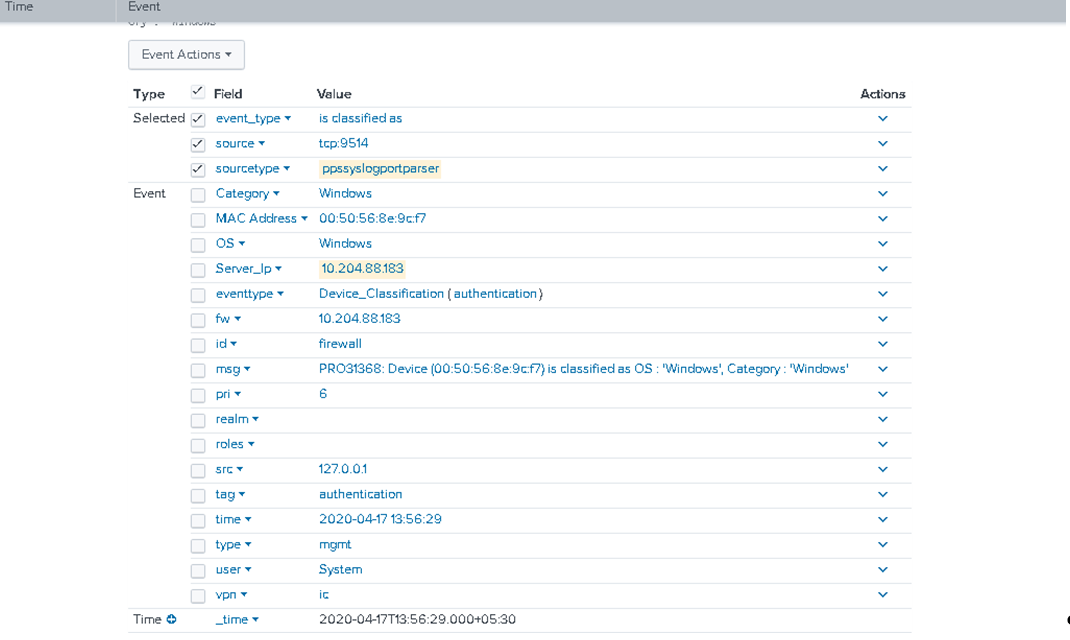
Example 3: Profiler Classification
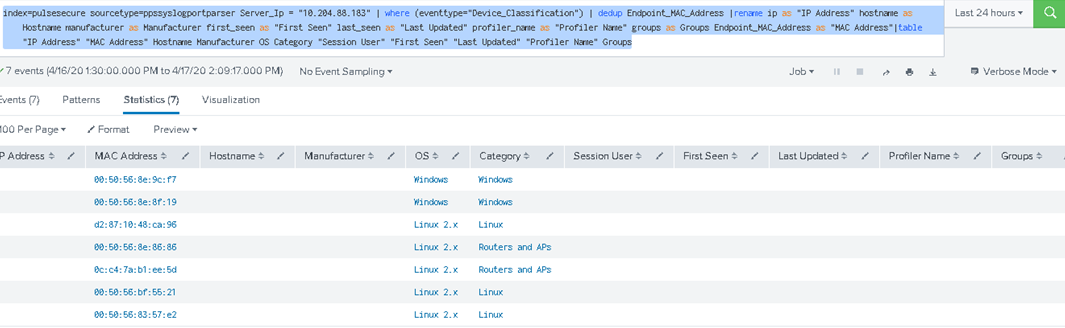
This sample query displays all the events from Pulse Policy Secure based on Pulse Profiler classification of endpoints.
index=pulsesecure sourcetype=ppssyslogportparser Server_Ip = "10.204.xx.xxx" | where (eventtype="Device_Classification") | dedup Endpoint_MAC_Address |rename ip as "IP Address" hostname as Hostname manufacturer as Manufacturer first_seen as "First Seen" last_seen as "Last Updated" profiler_name as "Profiler Name" groups as Groups Endpoint_MAC_Address as "MAC Address"|table "IP Address" "MAC Address" Hostname Manufacturer OS Category "Session User" "First Seen" "Last Updated" "Profiler Name" Groups
You can click the down arrow to view the event extract details.