Profiler Reports
Dashboard
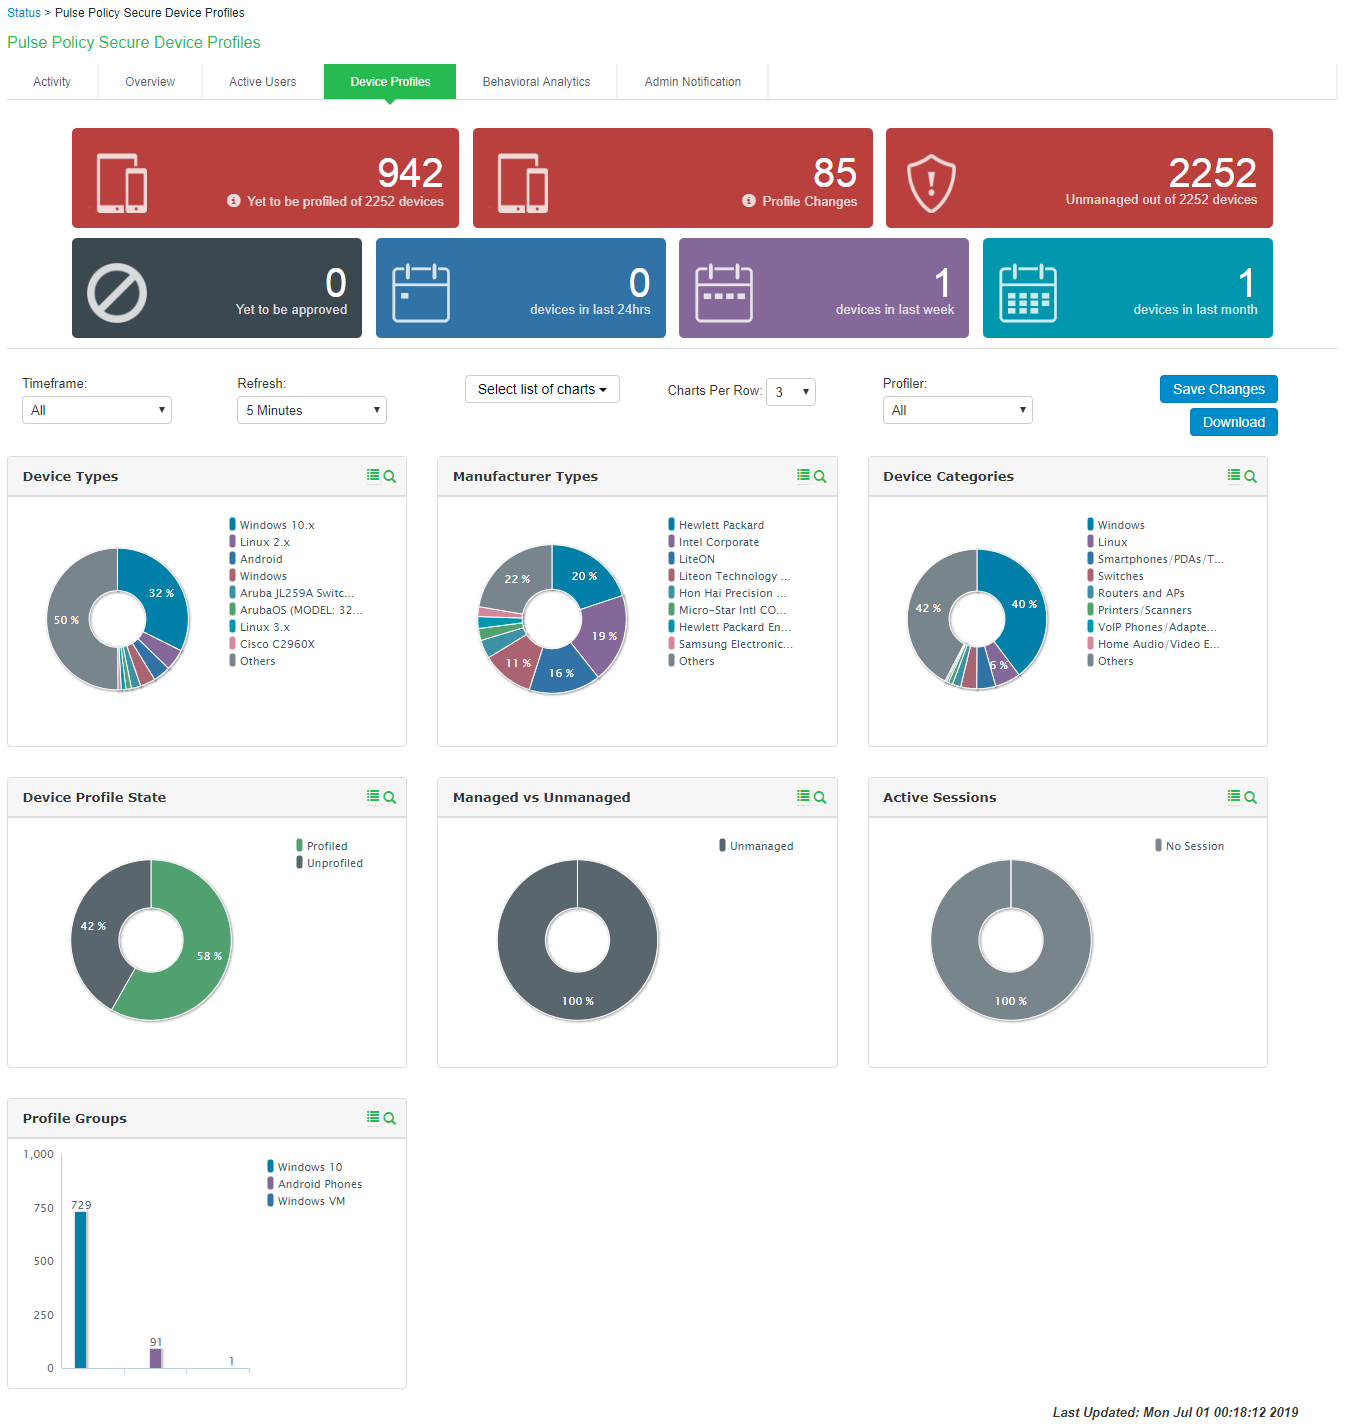
Once the Profiler is configured, profiling starts in the background. The Device Profiles Dashboard displays an overall summary of the devices that are discovered, profiled, and updated in the Device Discovery Table.
Navigate to Profiler > Dashboard and report > Dashboard or System > Reports > Device Discovery to display the device profiles page. Click on each chart or numbered panel to view detailed information in the device discovery report.
The upper part of the dashboard displays the number panels representing the number of devices for each of the following status:
- Devices waiting to be Profiled
- Devices for which the profile has changed
- Unmanaged devices
- Devices waiting for administrator approval
- Devices added in last 24 hours
- Devices added last week
- Devices added last month
You can customize the charts in the dashboard by setting the following parameters:
- Timeframe: The charts display information for the specified timeframe. By default, the information for the last 24 hours is displayed. The timeframe can also be set to 7 days, 30 days, or All.
- Refresh: The refresh time interval to update the charts. By default, the charts refresh every 5 mins. The time interval can also be set to disabled, 10 minutes, 30 minutes, or 60 minutes.
- Select list of charts: List of charts to select to display in the dashboard.
- Charts Per Row: Number of charts to display in a row on the dashboard. By default, 3 charts are displayed in a row. 1 or 2 charts can be displayed in each row.
- Profiler: The profiler for which the information is displayed. By default, information for all profilers are displayed.
The dashboard displays the following charts:
- Device Profile State: Represents the device classification based on Profile status such as Profiled devices, Unprofiled devices, Profile changed devices.
- Manufacturer Types: Represents the device classification based on the device manufacturer. For example, VMware. Inc, Apple. Inc
- Device Categories: Represents the device classification based on the device categories such as smartphones, laptops, windows.
- Device Types: Represents the device classification based on device types. For example, Windows, Apple iPod, iPhone.
- Managed vs Unmanaged: Represent the device classification on the managed and unmanaged device status. Managed devices are detected by the MDM or a Pulse Client session is established on the device.
- Active Sessions: Represent the devices based on the device sessions such as Remote sessions and On-Premise session.
- Profile Groups: Represents the profile groups based on the device classification. For more information, see Profile Groups.
You can view the charts on the dashboard or download as a report in PDF format. You can also schedule to send the reports as an email.