Creating Services Director Reports
Viewing Reports and Diagnostics
The Home page of the Services Director VA shows a number of summary graphs:
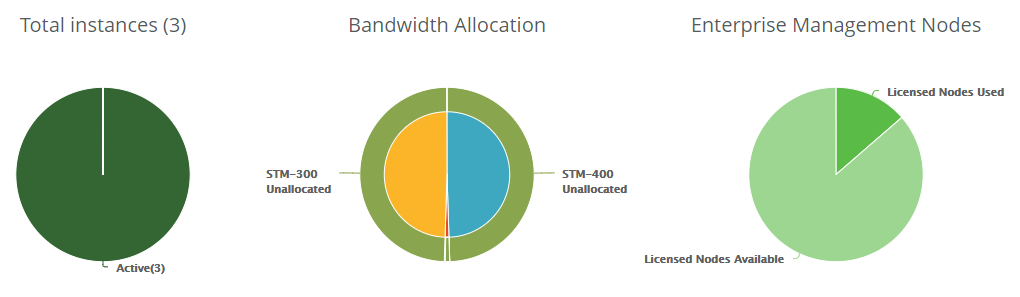
The Activity menu in the Services Director VA enables you to generate detailed reports about your current Virtual Traffic Manager (vTM) instances, bandwidth allocation, CPU utilization, and throughput. You can view how your resources are utilized so that you can adjust and reallocate resources as needed.
You can view the following reports:
•vTM Instance Allocation - The number of vTM instances, grouped by either instance host or feature pack, and the current status of each: Active, Idle, or Failed. For details, see The vTM Instance Allocation Report.
•Bandwidth Allocation - The current bandwidth allocation by SKU or feature pack. For details, see The Bandwidth Allocation Report.
•CPU Utilization - The current CPU utilization, grouped by either vTM instance or instance host. For details, see The CPU Utilization Report.
•Throughput Utilization - The current data throughput, grouped by either vTM instance or instance host. For details, see The Throughput Utilization Report.
Historical reports are not available in this release.
The vTM Instance Allocation Report
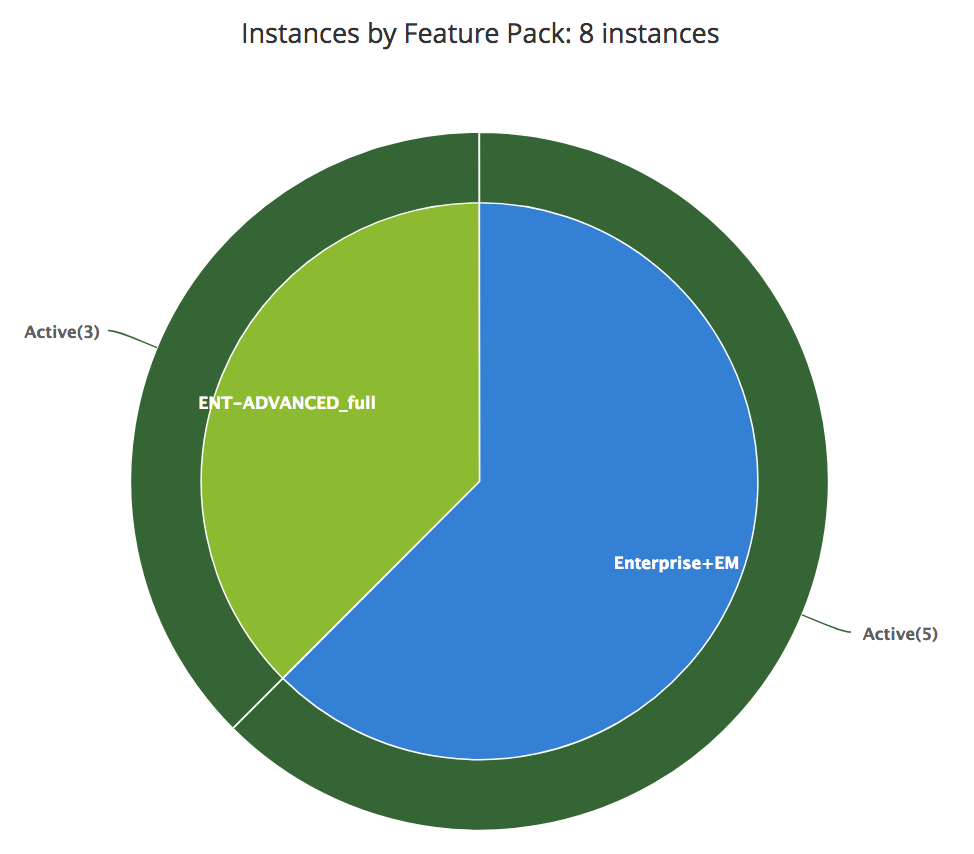
The vTM Instance Allocation report summarizes the status of all instances as a series of pie charts. The main page is a two-layer pie chart. The inner layer is divided by feature pack by default, while the outer layer is divided by instance status.
The vTM Instance Allocation report answers these questions:
•What is the current status of my instance hosts?
•What is the current status of a particular instance host?
•What is the current status of my feature packs?
•What is the current status of a particular feature pack?
The report displays the number of instances and the status with that feature pack. You can drill down into each individual feature pack and another pie chart is presented that gives you a report on that feature pack. You also have the option to divide the inner layer of pie chart in the main page by instance host. Similarly, you can drill down into each instance host.
The vTM Instance Allocation report displays the current status of instances in a color coded format.
|
Instance Status |
Color |
Description |
|
Active |
Green |
An instance that is currently running. |
|
Failed |
Red |
An instance has failed to start. |
|
Idle |
Blue |
An instance that has been deployed but is not currently running. |
Pause the pointer over a specific area of the pie chart to view the feature pack or instance name (depending on the option chosen) and the number of instances.
Drill down into data by clicking an inner section of the graph.
Viewing the vTM Instance Allocation Report
To view the vTM Instance Allocation report:
1.Click Activity > vTM Instance Allocation to display the vTM Instance Allocation report page.
2.Use the Options to change the report type:
•Instance host. Then, select a specific instance host for the report, or select All.
•Feature pack. Then, select a specific feature pack for the report, or select All.
When you select All, you can double-click an instance or feature pack in the pie chart to view details for the selected instance or feature pack.
3.Drill down into data by clicking one of the inner sections.
The Bandwidth Allocation Report
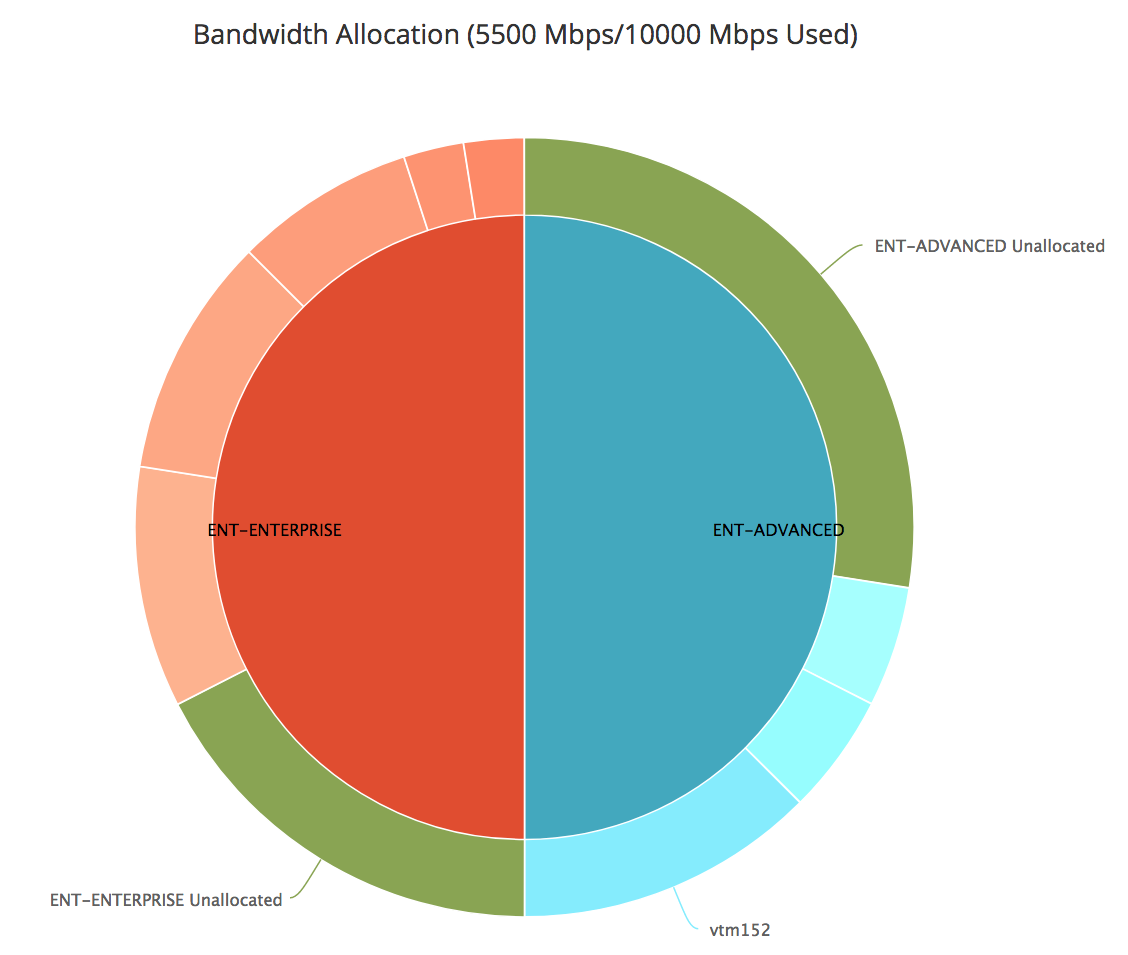
The Bandwidth Allocation report displays allocated bandwidth for your vTM instances by SKU or feature pack. When you create an instance, you must specify which feature pack you want to use; you do not specify the SKU.
The Bandwidth Allocation report answers these questions:
•How much bandwidth is allocated to a SKU or instance?
•How much bandwidth is unallocated for a SKU or instance?
The Bandwidth Allocation report is a set of pie charts. The main page is a two-layer pie chart. The inner layer is divided by licensed tied SKUs. The outer layer shows the bandwidth allocated to each of instances and total size of available bandwidth of each SKU.
You cannot specify how much bandwidth you want to reserve for a given feature pack.
You can use the Bandwidth Allocation report to evaluate whether or not you need to reallocate bandwidth or purchase additional bandwidth licenses.
Pause the pointer over a specific area of the pie chart to view the allocated and unallocated bandwidth for a Pulse Secure Virtual Traffic Manager SKU or instance.
Drill down into data by clicking an inner section of the graph.
To view the Bandwidth Allocation report:
1.Click Activity > Bandwidth Allocation to display the Bandwidth Allocation report page.
2.Pause over a graph section with the pointer to view a summary.
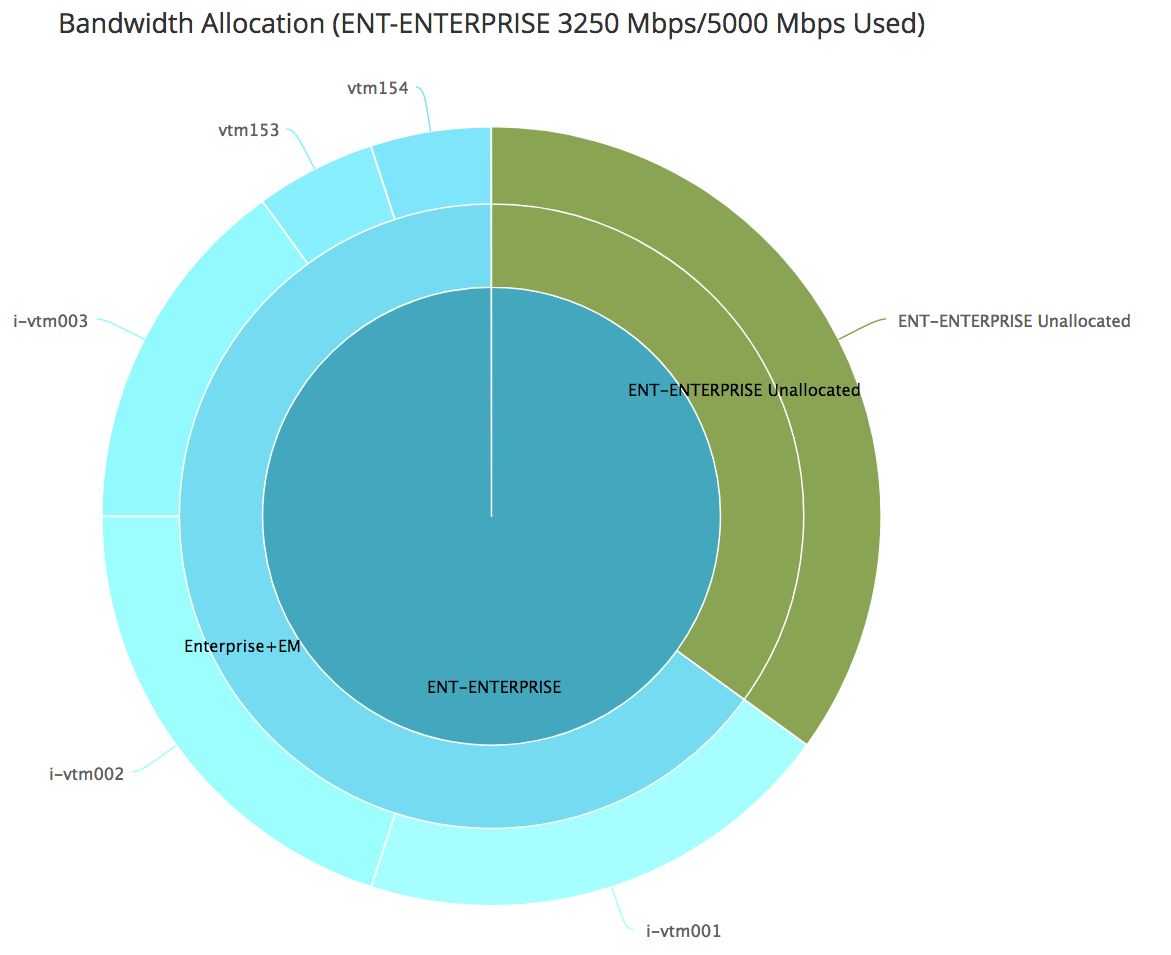
3.To drill down into a particular SKU, double-click the area you want to view. A three-layer pie chart appears:
•The inner layer displays the particular SKU.
•The middle layer is divided by feature pack created for that SKU.
•The outer layer represents the bandwidth allocated for each of instance.
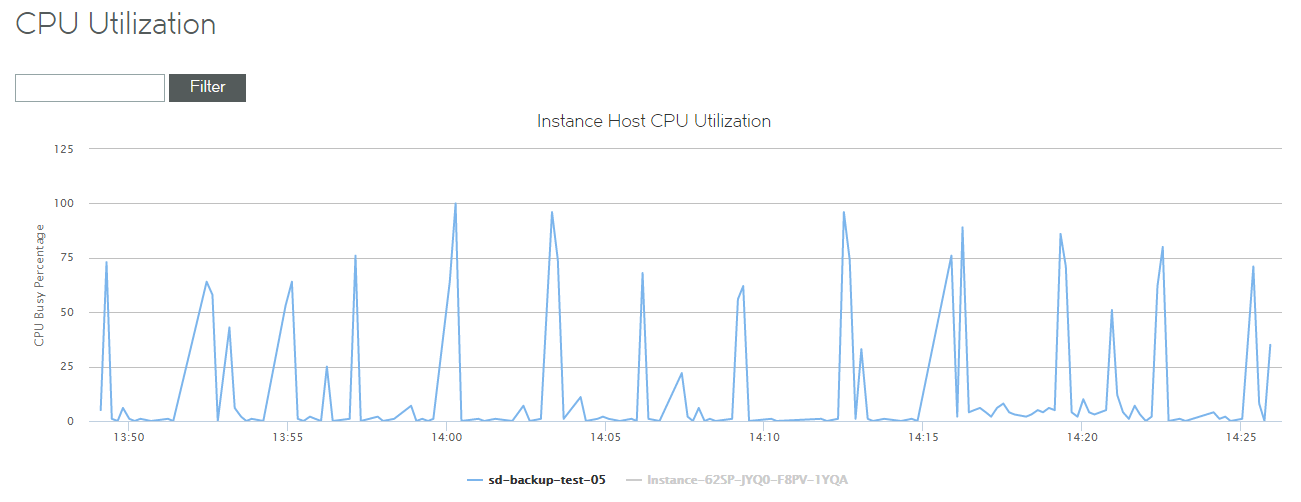
The CPU Utilization Report
The CPU Utilization report displays real-time CPU usage by percentage over time of each instance in an Active state and the aggregated CPU usage of all Active instances on each host.
The CPU Utilization report answers these questions:
•How much of the CPU is being used?
•What is the average and peak percentage of the CPU being used?
The CPU Utilization report is a streaming line chart. The hosts and Active instances are listed at the bottom of line charts. You can choose which host or instance CPU usage to displayed in the chart. If you have too many Active instances, there is a Filter box from which you can filter the report by instance name. Ivanti recommends you use the regular expression name.
Viewing the CPU Utilization Report
1.Click Activity > CPU Utilization to display the CPU Utilization report page.
2.To view a graph of data points over time, keep the page open. Data points are graphed every ten seconds.
3.To toggle on and off the graph for an instance host, click the instance hostname at the bottom of the page.
4.To view the CPU utilization for a particular instance, enter the vTM instance name and click Filter.
5.To clear the data, refresh the page.
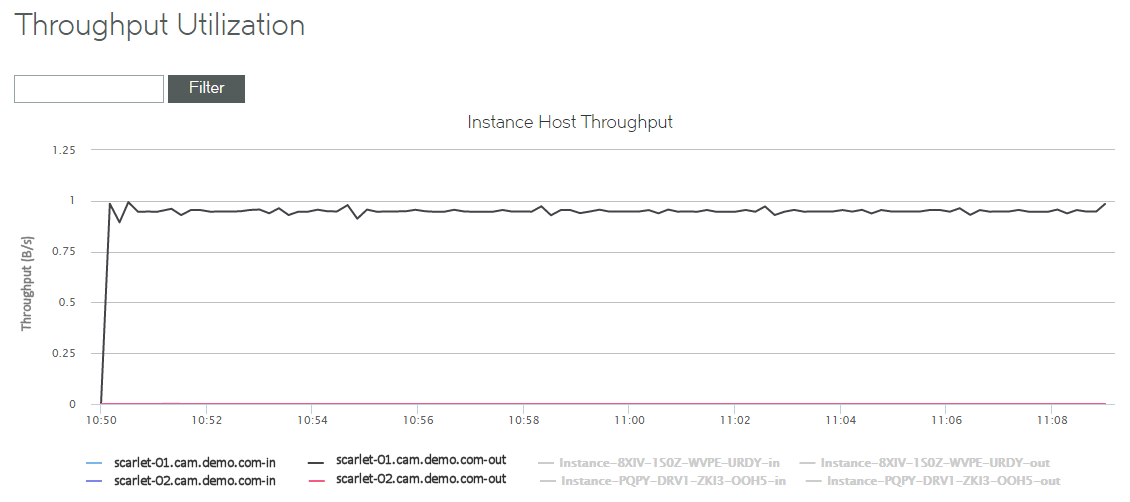
The Throughput Utilization Report
The Throughput Utilization report displays the real-time throughput utilization (in B/s) of each instance in an Active state and aggregated throughput utilization on each host.
The Throughput Utilization report answers these questions:
•What was the average throughput?
•What was the peak throughput?
The Throughput Utilization report is a streaming line chart. The real-time throughput per second and peak throughput in last hour is displayed in the chart.
The displayed throughput includes both incoming and outgoing throughput.
Review the Throughput Utilization report to find out which instances use the most throughput, and then compare the results to the results you expected. For example, you might expect a lot of throughput for an instance that hosts a popular site. However, if an instance is using more throughput than expected, you can try to discover why so that you can make the appropriate adjustments.
You can also use the Throughput Utilization report to monitor how close you are to reaching your license limitations, so that you can evaluate whether or not you should purchase additional licenses.
Pause the pointer over a specific data point to see what its value and exact time stamp were in relation to peaks.
To view the Throughput Utilization report:
1.Click Activity > Throughput Utilization to display the Throughput Utilization report page.
2.To view the throughput for a particular instance, enter the vTM instance name and click Filter.
Viewing Logs and Generating System Dumps
You can view system logs and generate system dumps from the Diagnose tab.
Viewing System Logs
You can view current logs for the Services Director in the System Logs page.
1.Click Diagnose > System Logs to display the System Logs page.
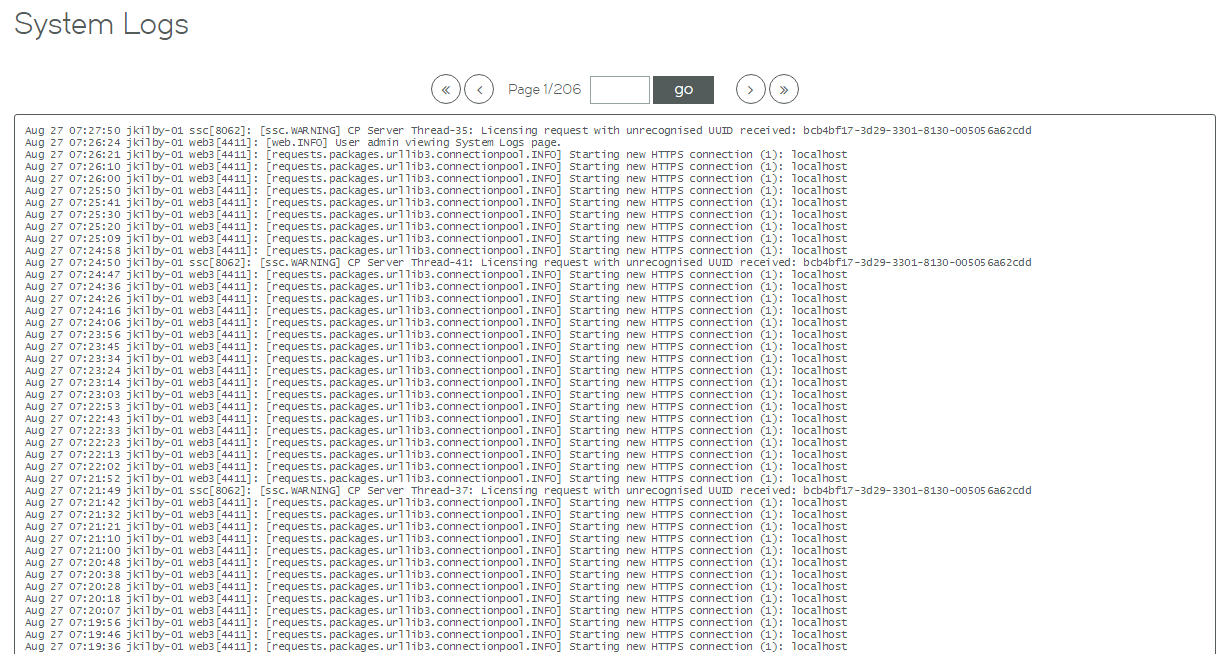
2.Click << (first), < (previous), > (next) or >> (last) to navigate through the log pages.
Alternatively, type a number in the Page text box and click Go to navigate to a specific page.
Generating System Dumps
You can generate system dumps for the Services Director from the Diagnose menu.
You can tailor the contents of the system dumps to include statistics if required.
1.Click Diagnose > System Dumps to display the System Dumps page.
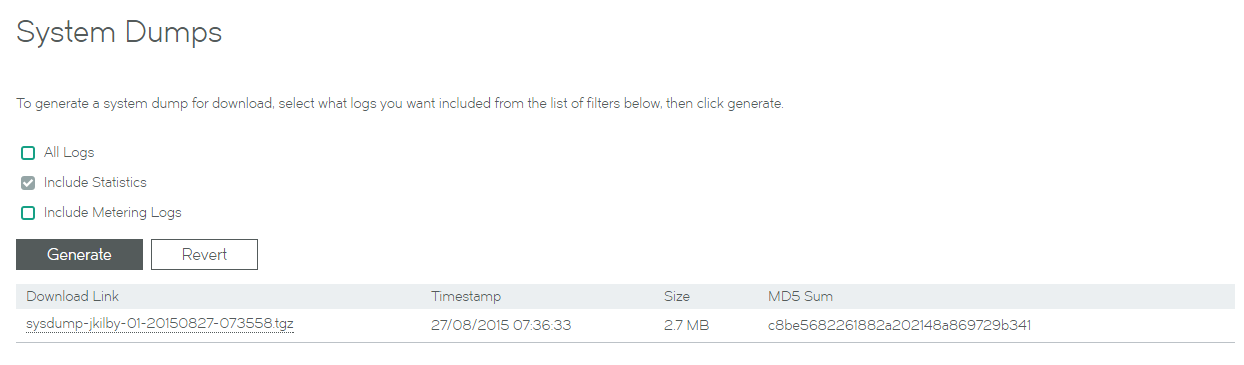
2.Complete the configuration according to this table.
|
Control |
Description |
|
All Logs |
Select to generate all current system logs. |
|
Include Statistics |
Select to include all statistics in system dump files. |
|
Include Metering |
Select to include all metering logs in system dump files. |
3.Click Generate to create the system dump.
Generated logs are listed in a table of download hyperlinks.
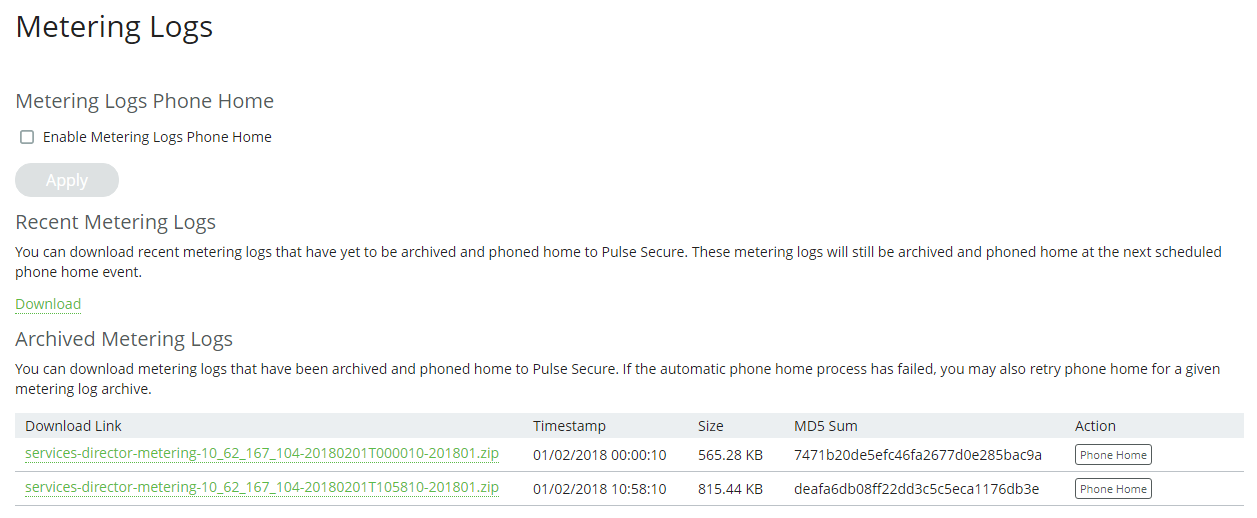
Working with Metering Logs
The Metering Logs page enables you to download and manage metering log files. The files are created as .ZIP files and listed in a table. A maximum of ten metering logs can be generated by this process.
Cloud Service Provider customers must ensure that SNMP is enabled on all externally-deployed vTMs to support metering.
You can monitor the capacity of the /data partition that is used for the storage of metering logs. See Monitoring the Storage Capacity of Metering Logs.
You can also download any listed log files directly from the table.
You can also enable/disable the phone home feature from this page, see Configuring the Phone Home Function. For details of the phone home feature, refer to the Pulse Services Director Advanced User Guide.
Generating Metering Logs
1.Click Diagnose > Metering Logs to display the Metering Logs page.
2.Clear the Enable Metering Logs Phone Home check box.
3.Click Generate to create the metering logs.
Downloading Metering Logs
1.Click Diagnose > Metering Logs to display the Metering Logs page.
2.Click the name of the required log file (.ZIP) in the metering log table.
3.Select a save location and click Save.
Deleting Metering Logs
You can delete individual metering logs from the Metering Logs page.
1.Click Diagnose > Metering Logs to display the Metering Logs page.
2.Under Archived Metering Logs, locate a metering log file (.ZIP) that you want to delete.
3.To the right of the metering log entry, click the X control. A confirmation control appears.
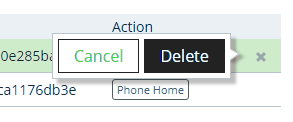
4.Click Delete.
5.Repeat this procedure to delete additional metering logs.
You can also delete all metering logs as a single action from the Data Storage Status page, see Monitoring the Storage Capacity of Metering Logs.
Monitoring the Storage Capacity of Metering Logs
The Services Director VA uses its /data partition to store both database replication logs and instance metering logs. The Data Storage Status page enables you to:
•View the available and used space in the /data partition.
•Delete any archived metering logs.
You cannot delete replication logs from the Services Director VA.
•Configure the number of days for which database replication logs are kept.
A Standby Services Director can only remain offline for this many days, after which it will be unable to restore itself to the current state of the database.
To access and use the Data Storage Status page:
1.Click Diagnose > Data Storage Status to display the Data Storage Status page.
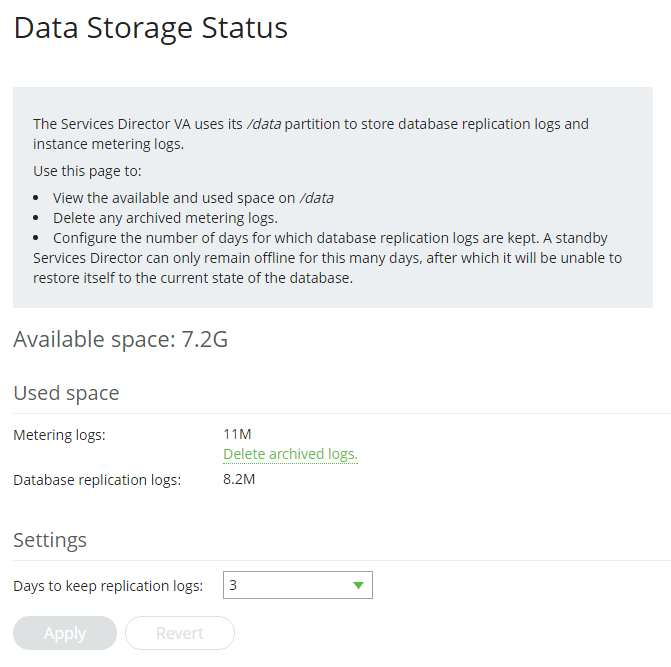
2.Examine the displayed capacity information and evaluate if any action is required.
3.(Optional) Delete all metering logs. To do this:
•Click Delete archived logs to clear replication logs from the /data partition. A warning dialog appears:
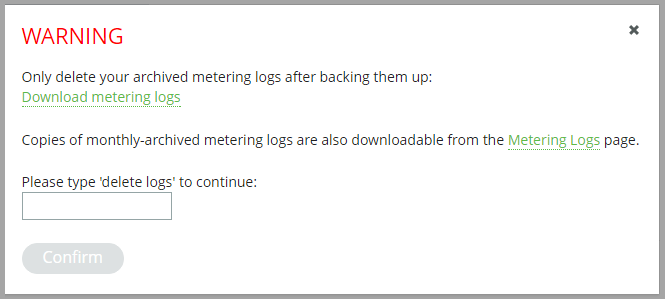
•(Optional) Click Download metering logs to download a .TGZ file containing all metering logs.
•(Optional) Click Metering logs to view the Metering Logs page. From here you can download or delete individual metering log files. See Downloading Metering Logs and Deleting Metering Logs.
•Type “delete logs” into the text box and click Confirm to delete all archived metering logs.
4.(Optional) Click the list for Days to keep replication logs and choose a number of days to retain replication logs, and click Apply.
A Standby Services Director can only remain offline for this many days, after which it will be unable to restore itself to the current state of the database.
Configuring the Phone Home Function
You can configure the phone home function from the Metering Logs page.
1.Click Diagnose > Metering Logs to display the Metering Logs page.
2.Select the Enable Metering Logs Phone Home check box.
3.Click Apply to confirm your setting.
A warning e-mail will be sent every 24 hours if the phone home feature is enabled and Services Director is unable to connect to the phone home server.
You can also manually phone home an individual metering log file, see Manually Phoning Home a Metering Log File.
Manually Phoning Home a Metering Log File
You can manually phone home an individual metering log file from the Metering Logs page.
1.Click Diagnose > Metering Logs to display the Metering Logs page.
2.Under Archived Metering Logs, locate a metering log file (.ZIP) that you want to phone home.
3.To the right of the metering log entry, click the Phone Home action. The log file is phoned home.
Understanding Metering Logs
The Services Director automatically meters usage on a regular basis, and it optionally sends this information to Ivanti for billing purposes. By default, it records this information once per hour.
If a vTM instance is Active, the Services Director polls it to obtain total throughput and peak activity metrics. The Services Director creates a metrics log file with one line of metrics data for each vTM instance. Each line of metrics data records the name of the instance, the time elapsed since the resource was created, and the polled metrics. If an instance is not active, only the elapsed time is recorded.
If you want to generate usage or billing information, typically you process all metering log files and aggregate the results. You should use caution when aggregating data results for billing since metering records include failed deployments.
Generating log files has a cumulative impact on disk space.
The Services Director collects metering data from vTM instances as follows:
•Instances that are at version 9.4 or earlier (or have no REST API enabled) have their metering collected through SNMP.
•Instances that are at version 9.5 or later with the REST API enabled have their metering collected through their REST API. If REST-based metering fails (or is not possible), the Services Director falls back to collecting using SNMP. Any metering issues will be included in the warning logs, as before.
The Services Director records the most recent metrics information for each instance in the inventory database. You can obtain this data using the REST API. The REST API does not supply bulk metrics data.
The Metering Log file is structured as follows:
•The first row contains version data for the metering log format. This first line can be ignored by customers. Ignore this line when you aggregate data for billing.
•Each subsequent row records one set of metrics for a vTM instance, in comma-separated value (CSV) format.
•The final line contains an MD5 hash of the previous lines. Ignore this line when you aggregate data for billing.
Each line of metrics contains the following fields:
|
Field |
Description |
|
Timestamp |
The date and time, in UTC format, that the line was written. |
|
Instance ID |
The unique instance ID for the vTM instance. |
|
Instance Tag |
This information may be empty but it is included, even if empty. |
|
Owner |
(Optional) The owner of the vTM instance. |
|
Cluster ID |
The cluster for the vTM instance. |
|
Management IP |
The management IP address of the vTM instance. |
|
Instance SKU |
The SKU (or SKU combination) assigned to the vTM instance (at the time of writing to the log). The SKU might vary between readings, and variations are not recorded in the metrics log file. This property includes a hash of features applicable to the SKU. Ignore these features for billing purposes. |
|
Feature Pack |
The feature pack assigned to the vTM instance (at the time of writing to the log). |
|
Deploy Time |
The length of time (in days, hours and minutes) since the instance was deployed. |
|
Throughput |
The number of bytes sent by the vTM instance, as recorded in the SNMP counter. This number is cumulative and is reset whenever the vTM instance is restarted. It is not the throughput since the latest metering action. To generate usage or billing information based on throughput, you should set your aggregating script to detect a drop in throughput and designate this as a restart. This property is applicable to active vTM instances only. For Idle or Inactive instances, it contains a value of 0 (zero) in the log. For uncontactable instances, it contains a value of -1 in the log. |
|
Peak Throughput |
The highest number of bytes sent by the vTM instance in any second of the previous hour. This property is applicable to active vTM instances only. For Idle or Inactive instances, it contains a value of 0 (zero) in the log. For uncontactable instances, it contains a value of -1 in the log. |
|
Peak Requests |
The highest number of requests received by the vTM instance in any second of the previous hour. This property is applicable to active vTM instances only. For Idle or Inactive instances, it contains a value of 0 (zero) in the log. For uncontactable instances, it contains a value of -1 in the log. |
|
Peak SSL Requests |
The highest number of Secure Socket Layer (SSL) requests received by the vTM instance in any second of the previous hour. This property is applicable to active vTM instances only. For Idle or Inactive instances, it contains a value of 0 (zero) in the log. For uncontactable instances, it contains a value of -1 in the log. |
|
Instance Bandwidth |
The bandwidth (in Mbps) allocated to the vTM instance. |
|
Record Hash |
An MD5 or similar hash of the record from the Services Director license file for tamper detection. Ignore this for billing purposes. |
If metrics are not collected for a period of time, peaks for the missing time are not recorded. If you reduce the metering interval, the peak values are still relative to the previous hour rather than the time since metrics were last collected.