Configuring the Splunk System
Introduction
The configuration process for your Splunk system requires a number of separate stages.
Many stages can be performed via both the Splunk system's CLI or GUI, but in some cases only the GUI is supported.
In rare cases, the only way to change a setting is by editing one of Splunk system's configuration files.
Creating Indexes
Services Director requires log data and transaction data to be in separate indexes. This keeps events data organized, allows different retention policies to be set, and can speed up searches.
CLI
1.Log into the Splunk server's command line using SSH.
2.Enter the /opt/splunk directory.
3.Run the following shell commands:
sudo bin/splunk add index zxtm_transactions -maxDataSize auto_high_volume
sudo bin/splunk add index zxtm_logs -maxDataSize auto_high_volume
GUI
1.Navigate to the Splunk system's web interface and login.
2.From the menu bar, select Settings > Data > Indexes.
3.On the Indexes page, click the New Index button.
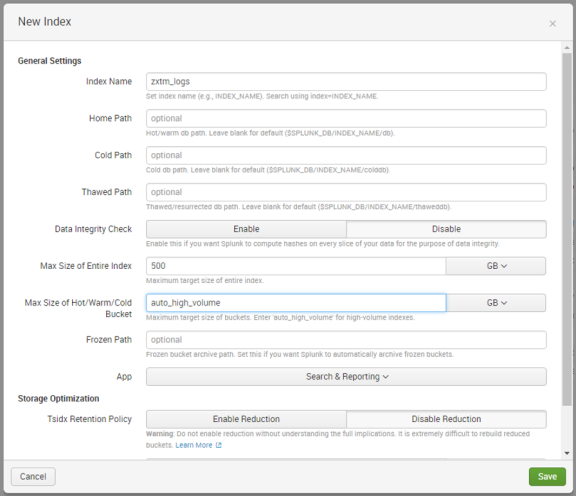
4.In the New Index dialog, complete the following fields:
•Index Name: zxtm_transactions.
•Max Size of Hot/Warm/Cold Bucket: auto_high_volume.
Leave all other fields with their default values. For example:
![]()
5.Click Save.
6.Click the New Index button.
7.In the New Index dialog, complete the fields as follows:
•Index Name: zxtm_logs
•Max Size of Hot/Warm/Cold Bucket: auto_high_volume
Leave all other fields with their default values. For example:
8.Click Save.
Creating a Source Type for Transactions
Creating a source type allows the Splunk system to interpret transaction data correctly. This cannot be done via the CLI.
GUI
Navigate to the Splunk system's web interface and login.
1.From the menu bar, select Settings > Data > Source types.
2.On the Source Types page, click the New Source Type button.
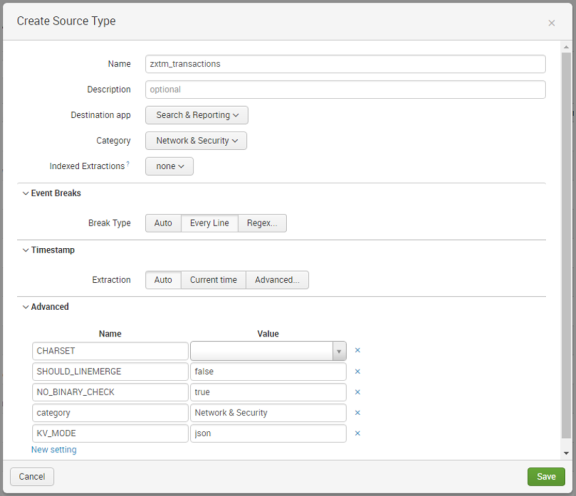
3.In the Create Source Type dialog, complete the following fields:
•Name: zxtm_transactions
•Category: Network & Security
•Indexed Extractions: none
4.In the Event Breaks section:
•Set Break Type to Every Line.
5.In the Timestamp section:
•Set Extraction to Auto.
6.In the Advanced section:
•Click New setting. A new entry row appears.
•In Name, type KV_MODE.
•In Value, select json.
Leave all other fields with their default values. For example:
7.Click Save.
Creating a Data Input for Transactions
You must now configure the Splunk system to listen for transaction data on port 5000.
This can be performed using either the Splunk system's CLI or GUI.
CLI
1.Log into the Splunk server's command line using SSH.
2.Enter the /opt/splunk directory.
3.Run the following shell command:
sudo bin/splunk add tcp 5000 -sourcetype zxtm_transactions -index zxtm_transactions -resolvehost true
GUI
1.Navigate to the Splunk system's web interface and login.
2.From the menu bar, select Settings > Data > Data inputs.
3.On the Data inputs page, under Local Inputs > TCP, click the Add New action.
The Add Data wizard starts.
4.In the Select Source pane of the wizard, complete the following field:
•Port: 5000.
Leave all other fields with their default values.
5.Click the Next > button.
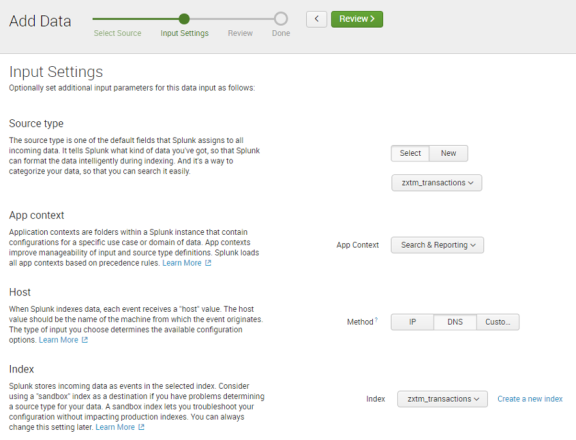
6.In the Input Settings pane of the wizard, complete the following fields:
•Under Source type:
•Click Select.
•Click Select source type and select Network & Security > zxtm_transactions.
•Under Host, select DNS.
•Under Index, select zxtm_transactions.
Leave all other fields with their default values. For example:
7.Click the Review > button.
8.In the Review pane of the wizard, review all selections. For example:
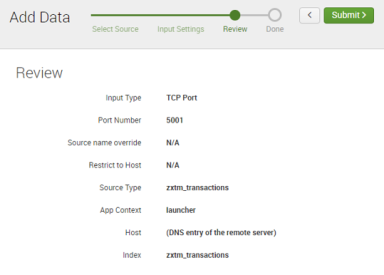
9.Click Submit >.
Creating a Data Input For Logs
The following steps will configure the Splunk system to listen for log data on the default HTTP Event Collector port (8088). This can be done via the Splunk system's CLI or GUI.
CLI
1.Log into the Splunk server's command line using SSH.
2.Enter the /opt/splunk directory.
3.Run the following shell command:
sudo bin/splunk http-event-collector create zxtm_logs -uri https://localhost:8089 -index zxtm_logs
4.Make a note of the token in the output of the above command. This is referred to as <auth-token> in later procedures.
5.Run the following command:
sudo bin/splunk http-event-collector enable -uri https://localhost:8089
GUI
1.Navigate to the Splunk system's web interface and login.
2.From the menu bar, select Settings > Data > Data inputs.
3.On the Data inputs page, under Local Inputs > HTTP Event Collector, click the Add New action.
The Add Data wizard starts.
4.In the Select Source pane of the wizard, complete the following field:
•Name: zxtm_logs
Leave all other fields with their default values.
5.Click the Next > button.
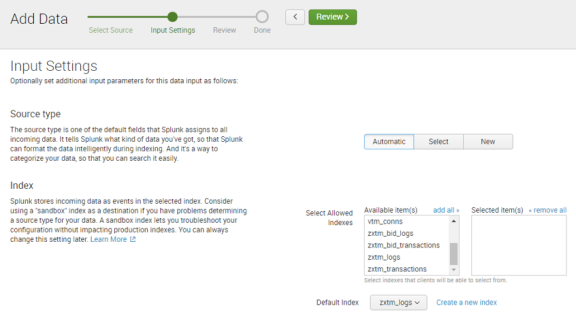
6.In the Input Settings pane of the wizard, complete the following fields:
•Under Source type, click Automatic.
•Under Index:
•Select Allowed Indexes: Ensure there are no selections.
•Default Index: zxtm_logs.
For example:
7.Click the Review > button.
8.In the Review pane of the wizard, review all selections. For example:
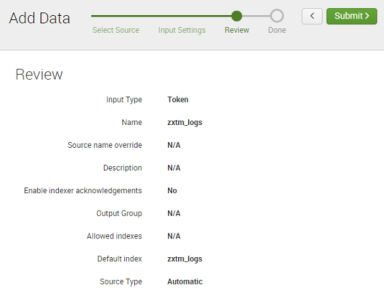
9.Click Submit >.
A confirmation screen is displayed. For example:
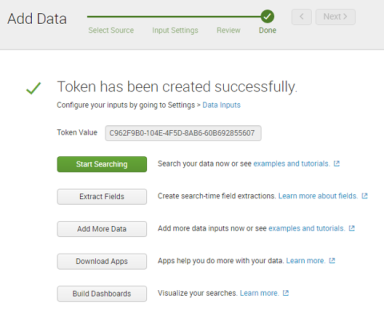
10.Make a note of the Token Value.
11.From the menu bar, select Settings > Data > Data inputs.
12.On the Data inputs page, click Local Inputs > HTTP Event Collector.
The HTTP Event Collector page appears. For example:
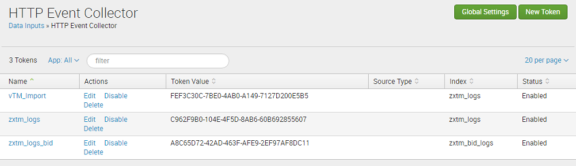
13.Click Global Settings.
The Edit Global Settings dialog appears.
14.In the Edit Global Settings dialog, complete the following field:
•All Tokens: Enabled
Leave all other fields with their default values. For example:
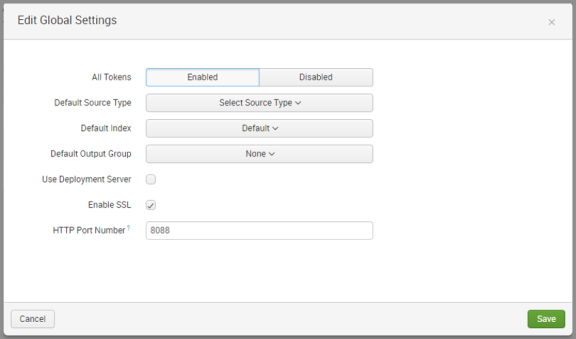
15.Click Save.
Setting Up Event Log Entry Parsing
You can configure the Splunk system to extract additional data from the event logs. Unfortunately, this cannot be done via the CLI. Additionally, for Splunk versions below 7, only some parts can be done via the GUI. Alternative instructions are provided where required in the GUI section below.
GUI
1.Navigate to the Splunk system's web interface and login.
2.From the menu bar, select Settings > Knowledge > Fields.
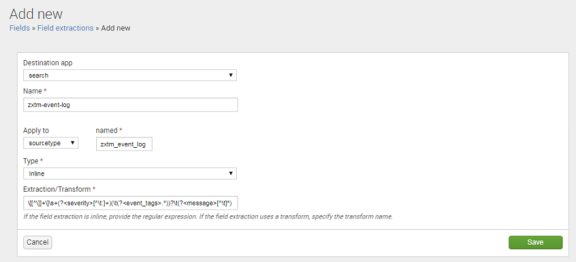
3.On the Fields page, under Field extractions, click the Add New action.
4.On the Add new page, complete the following fields:
•Destination app: search
•Name: zxtm-event-log
•Apply to: sourcetype
•Named: zxtm_event_log
•Type: Inline
•Extraction/Transform: Cut/paste the following code extract.
\[[^\]]+\]\s+(?<severity>[^\t:]+)(\t(?<event_tags>.*))?\t(?<message>[^\t]*)
For example:
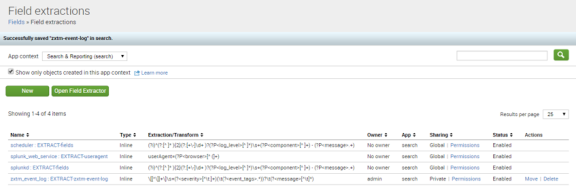
5.Click Save. The addition is confirmed. For example:
6.If your Splunk version is before 7, perform the following steps:
•From a shell prompt, edit the etc/users/admin/search/local/transforms.conf file, creating the directory and file if necessary.
•Cut/paste the following content into the file:
[zxtm-event-tags]
CLEAN_KEYS = 0
DELIMS = "\t"
FIELDS = tag, tag, tag, tag, tag, tag
MV_ADD = 1
SOURCE_KEY = event_tags
•Save and close the file.
•Run the following command:
sudo bin/splunk restart
7.If your Splunk version is 7 or above, perform the following steps:
•From the menu bar, select Settings > Knowledge > Fields.
•On the Fields page, under Field transformations, click the Add New action.
•On the Add new page, complete the following fields:
•Destination app: search
•Name: zxtm-event-tags
•Type: delimiter-based
•Delimiters: "\t"
•Field list: tag, tag, tag, tag, tag, tag
•Source key: event_tags
•Create multivalued fields: Select this check box.
•Automatically clean field names: Clear this check box.
For example:
![]()
•Click Save.
8.From the menu bar, select Settings > Knowledge > Fields.
9.On the Fields page, under Field extractions, click the Add New action.
10.On the Add new page, complete the following fields:
•Destination app: search
•Name: zxtm-event-tags
•Apply to: sourcetype
•Named: zxtm_event_log
•Type: Uses transform
•Extraction/Transform: zxtm-event-tags
For example: Refer to the Figure: Add New Field Extractions
11. Click Save.
Setting Up Audit Log Entry Parsing
You can configure the Splunk system to extract additional data from the audit logs. Unfortunately, this cannot be done via the CLI. Additionally, for Splunk versions below 7, only some parts can be done via the GUI. Alternative instructions are provided where required in the GUI section below.
GUI
1.Navigate to the Splunk system's web interface and login.
2.If your Splunk version is before 7, perform the following steps:
•From a shell prompt, edit the etc/users/admin/search/local/transforms.conf file, creating the directory and file if necessary.
•Cut/paste the following content into the file:
[zxtm-audit-fields]
CLEAN_KEYS = 0
DELIMS = "\t", "="
FIELDS =
•Save and close the file.
•Run the following command:
sudo bin/splunk restart
3.If your Splunk version is 7 or above, perform the following steps:
•From the menu bar, select Settings > Knowledge > Fields.
•On the Fields page, under Field transformations, click the Add New action.
•On the Add new page, complete the following fields:
•Destination app: search
•Name: zxtm-audit-fields
•Type: delimiter-based
•Delimiters: "\t", "="
•Field list: Enter a single space.
•Source key: _raw.
•Create multivalued fields: Clear this check box.
•Automatically clean field names: Clear this check box.
For example:
![]()
•Click Save.
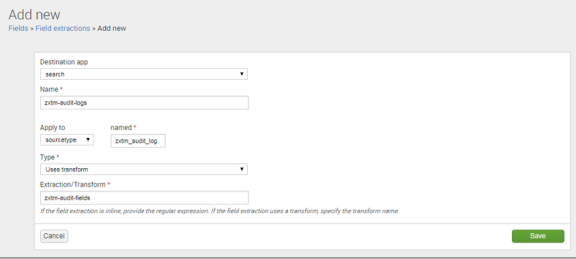
4.On the Fields page, under Field extractions, click the Add New action.
5.On the Add new page, complete the following fields:
•Destination app: search
•Name: zxtm-audit-logs
•Apply to: sourcetype
•Named: zxtm_audit_log
•Type: Uses transform
•Extraction/Transform: zxtm-audit-fields
For example:
6. Click Save.
Setting Up Case-Insensitive Searches for HTTP Headers
HTTP header field names are treated as case-sensitive in the Splunk system. This is opposite to the general HTTP specification of HTTP header field names, which are case-insensitive.
As a result, you may want your Splunk system to search for multiple variants of the field name. For example, User-Agent, User-agent and USER-AGENT. To do this, field aliases must be added. Unfortunately, this cannot be performed using the CLI.
The built-in header filters always search using title case. For example, HTTP Request Header User-Agent. If you require case insensitivity for other data exported by the Traffic Manager (for example, http.request.cookies or http.response.cookies), repeat the steps below for the affected headers.
GUI
1.Navigate to the Splunk system's web interface and login.
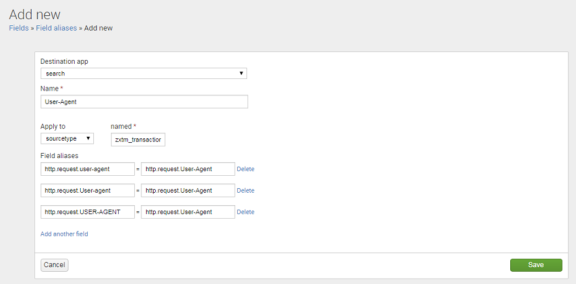
2.On the Fields page, under Field aliases, click the Add New action.
3.On the Add new page, complete the following fields:
•Destination app: search
•Name: Enter your own choice of name for the alias. For example, User-Agent.
•Apply to: sourcetype
•Named: zxtm_transactions
4.Decide on a consistent name for all of the variants. This name will be used in searches. For example, Consistent_Name.
5.For each case-sensitive variant of Consistent_Name, create a Field alias entry (adding extra entries as required by clicking Add another).
•For request header variants, each Field alias entry should take the form:
http.request.<variant> = http.request.<Consistent_Name>
•For response header variants, each Field alias entry should take the form:
http.response.<variant> = http.response.<Consistent_Name>
You do not need to create a Field alias entry that exactly matches Consistent_Name.
For example:
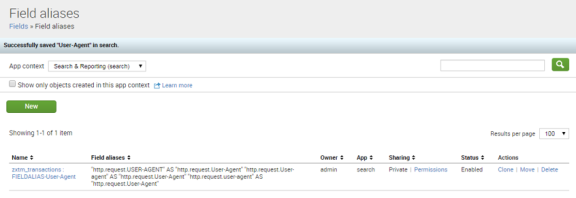
6.Click Save.
A summary of the new alias appears. For example: