Introduction
Clusters of Pulse Secure Virtual Traffic Manager (Traffic Manager) versions 17.2 (or later) can be configured to export live analytics data to an external Splunk analytics system. This requires theTraffic Managers to be in the estate of Services Director version 18.1 (or later). EachTraffic Manager cluster can export data about all the traffic they process, and can also export entries from log files present on the individual cluster members.
Splunk is a business intelligence tool that allows you to collect, store, search, analyze and visualize data. The deployment guide assumes that you already have a Splunk deployment running; see https://www.splunk.com for details on how to get started with Splunk if you are not already familiar with it.
There are a variety of deployment models for Splunk analytics software, so the instructions in this guide may need to be adapted to suit your own Splunk deployment.
This guide leads users through a set of steps after which they should have a Services Director capable of:
•Configuring some or all of its estate of Traffic Managers to export log and transaction analytics data to an external deployment of Splunk analytics software.
•Querying that external deployment of Splunk analytics software in order to visualise and navigate the collected analytics data.
Key Concepts
Working with Splunk involves the following key concepts:
•Analytics records: A Traffic Manager (as of version 17.2 and onwards) is capable of exporting two types of analytics records, specifically transaction records and log records. Each transaction record deals with a connection or higher level request that has passed through a Traffic Manager. Each log record is a single log line from a Traffic Manager log. These different record types are stored in two separate indices within the Splunk system. The Traffic Manager exports transaction records over a TCP connection, which can optionally be secured with TLS. Log records are exported with HTTP POST requests, and can also be sent over a secure connection if necessary. Both types are exported as JSON objects, with individual records separated by newline characters.
•Indexes: Indexes are where a Splunk system stores the data it receives. Transaction records and log records from the Traffic Manager are stored in separate indexes to allow them to be queried independently (and independently of other unrelated data stored in the Splunk system) by the Services Director analytics application.
•Source Types: All records stored by a Splunk system have a 'sourcetype' field, which is assigned to the record by the Splunk system input that is configured to receive the raw analytics data. The sourcetype field references a 'source type' configuration object in the Splunk system's configuration, which controls how the raw data is parsed into separate records and how information such as the timestamp of the event can be determined. Transaction records and log records from the Traffic Manager have separate source types to allow transaction record and log record specific processing to occur.
Required Configuration
In order for the system to operate:
1.The Splunk system must be configured with appropriate collection endpoints to accept and store these records in the correct indices for later analysis. Specifically, the Splunk system must be configured with a raw TCP input and an HTTP Event Collector input. The raw TCP input will collect the transaction records, and the HTTP Event Collector will collect log records. Each has a different way of processing and storing the data it receives.
2.Services Director must be configured with details of these collection endpoints in order that it can configure the Traffic Manager estate to export analytics data to the Splunk system.
3.Services Director must also be configured with details of the Splunk system's search endpoint in order to allow the analytics application to direct queries at the Splunk system.
Services Director must be appropriately licensed with Enterprise Management resource pack licenses. Licensing is outside the scope of this document.
Network Diagram
Architecturally speaking, the system can be considered to look as follows.
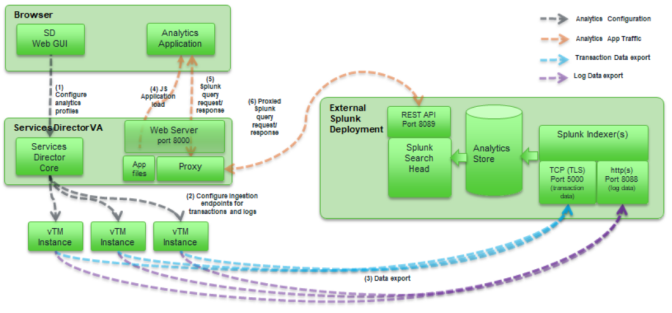
Please note the ports on which the browser, Services Director, Traffic Manager, and the Splunk system communicate:
•Port 8000 (on Services Director) - Web server (serving the Analytics application itself, and acting as a proxy to Splunk.
•Port 8089 (on Splunk system) - REST API offering query capability.
•Port 5000 (on Splunk system) - As configured by instructions in this guide, a TCP port for collection of analytics transaction records.
•Port 8088 (on Splunk system) - As configured by instructions in this guide, a HTTP(s) port for collection of analytics log records.
Prerequisites
The following instructions have been verified with Splunk versions 6.5.0 and 7.0.1.
You must already have the following deployed:
•A machine running a Splunk system.
•A Services Director 18.1 VA or later.
•A Traffic Manager that supports Analytics Export (version 17.3 or later).
You must also have done the following:
•Configured and started the Traffic Manager.
•Completed the Services Director Setup Wizard.
•Configured the Services Director to license the Traffic Manager so that it supports analytics export. Services Director should also show the Traffic Manager as healthy.
Accessing the Services Director VA CLI and OS Shell
The command-line instructions in this book intended for use on the Services Director VA require you to access the CLI and OS shell. For example (using the default amnesiac hostname):
1.Connect to the CLI. The login sequence appears. For example:
login as: admin
Pulse Secure Services Director
admin@<host>'s password:
Last login: <timestamp> from <IP_address>
amnesiac >
2.Enable configuration mode:
amnesiac > enable
amnesiac # configure terminal
amnesiac (config) #
3.(Optionally) Start the OS shell:
amnesiac (config) # _shell
[admin@amnesiac ~]#
4.You are now in the operating system shell, and can enter shell commands.
5.To exit the OS shell, type <ctrl> + D