Monitoring your Hardware
Your Traffic Manager appliance reports its condition through the Admin UI, with warnings and errors reported in the Event Log and Diagnose sections in common with other product variants. To monitor the Traffic Manager’s hardware status, you can additionally use the following appliance-specific Admin UI features.
Network Interfaces
To view details of the configured network interfaces on your appliance, click System > Networking > Interfaces.
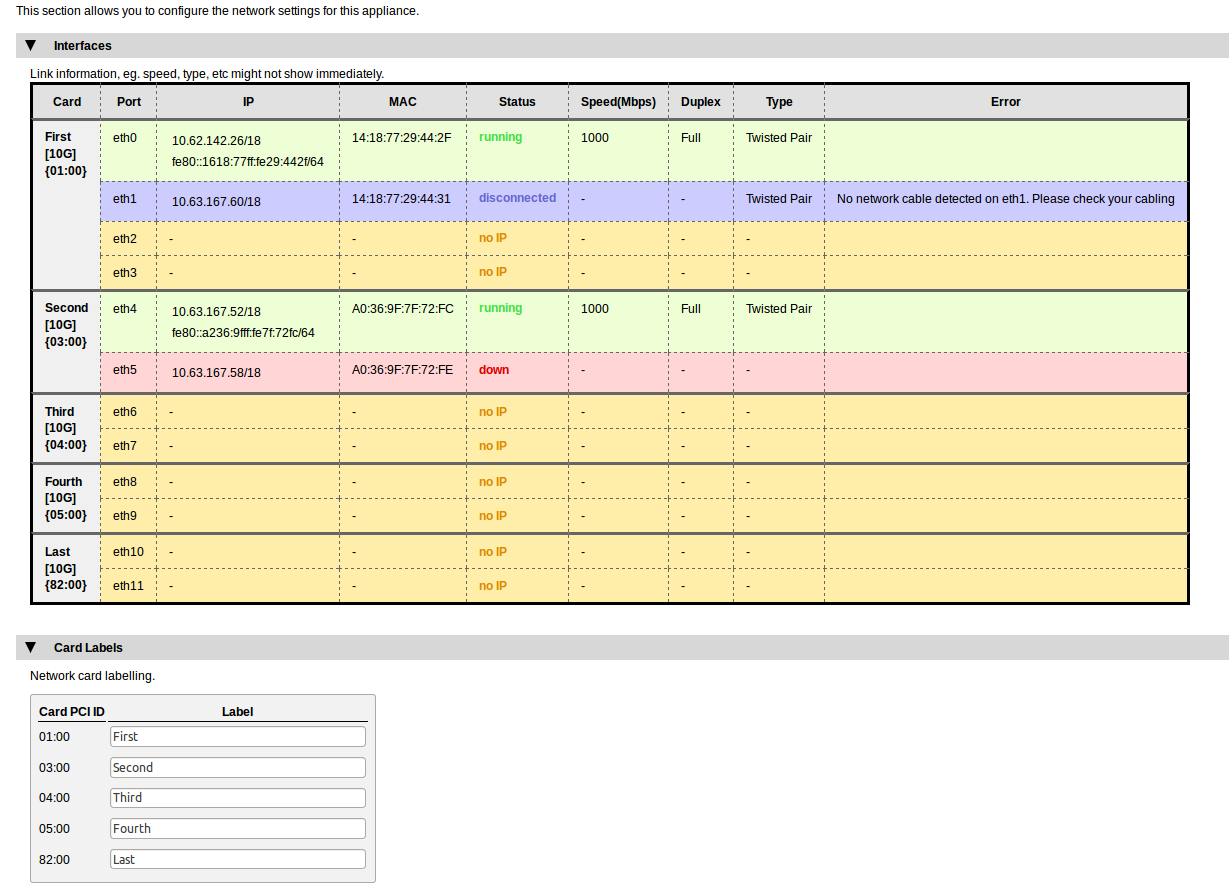
The table shows each network card attached to the appliance, with each network port on the card shown individually. The card is identified by it’s PCI ID and bandwidth class.
For each network port, the following parameters are shown:
•IP: The IP address assigned to this port.
•MAC: The hardware MAC address belonging to this port.
•Status: A short descriptive status for this port: "running", "down", "disconnected", and "no IP".
•Speed: The speed, in Mbps, this connection is operating at.
•Duplex: The duplex setting for this connection, either “Full” or “Half”.
•Type: The physical medium for this connection.
•Error: Any current error state information.
To aid identification of network cards, the Traffic Manager provides the ability to label individual cards with a suitable name. Use the Card Labels section to assign names to your cards based on the PCI ID.
Appliance Hardware Status Reporting
The Traffic Manager is capable of displaying the hardware status reported by an appliance IPMI management interface. To observe a basic health indicator for each appliance in your cluster, click System > Traffic Managers. Observe the “Hardware Status” indicator against each Traffic Manager, as shown here:

To view the full IPMI output for the current Traffic Manager appliance, click Diagnose > Hardware.
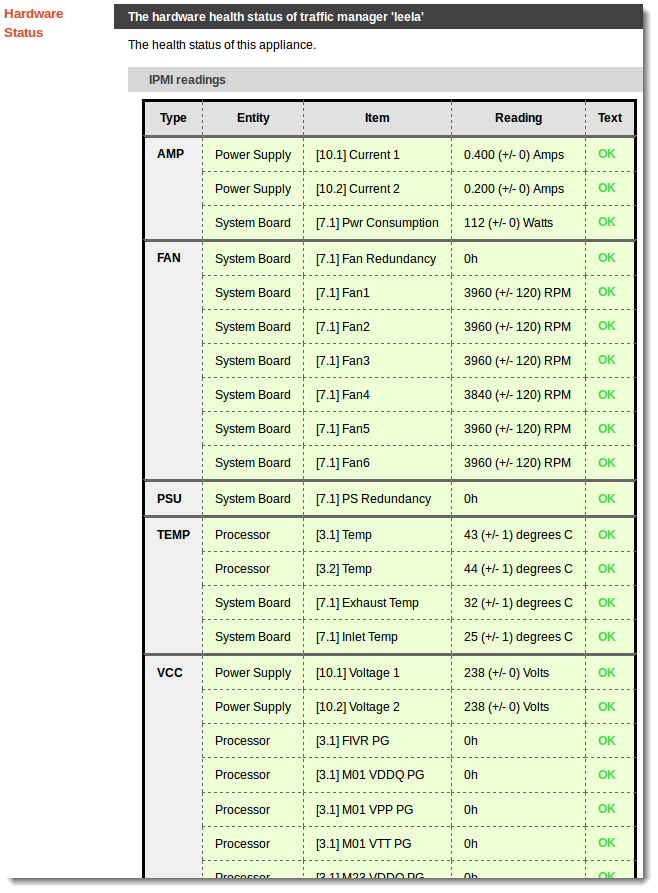
The Hardware Status page provides a list of hardware devices present in the appliance. Each device section contains a list of parameters along with the current reading and overall health state of that parameter.
Hardware status events and alarms are reported and logged in the Traffic Manager event log, with a visual indication of serious errors shown in the Admin UI.
This information is also present in a Technical Support Report (TSR).