Attack Analysis
Purpose
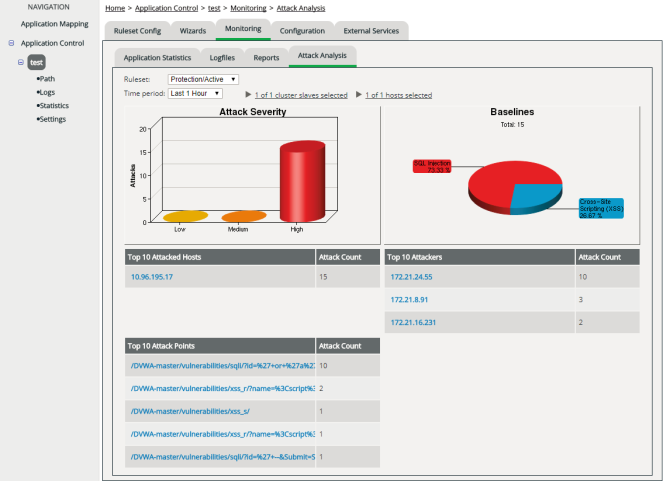
Attack Analysis lets you monitor the current attack status of an application at a glance.
You can see how many and which types of attacks were launched, and how severe these attacks were (if vWAF had not detected them). Also you can see which hosts were attacked, who the attackers were, and where exactly they tried to attack.
If the statistics function has been deactivated in the Global ConfigurationGlobal Configuration, there are no attack severity data and baseline distribution data available.
If you’ve disabled logging for individual handlers, these handlers aren’t accounted for in the lists. Disabling logging also prevents the actions of the handler from being taken into account for the Top-10 lists “Top 10 Attacked Hosts”, “Top 10 Attackers” and “Top 10 Attack Points” (see attribute “enable-logging” of individual handlers).
Opening
Information displayed
| Diagram | Meaning |
|---|---|
|
Attack Severity |
The diagram shows how many attacks have been launched within the selected period of time, allocated to each of the three severity classes "Low", "Medium" and "High". At a glance, this gives you an instant idea of the current threat. The mapping of attacks to one of the three security classes is determined by the handler that repelled the attack. Internally, each handler is assigned to one of the three severity classes. The diagram shows the total activity of handlers within each class. For details on severity, see Severity of Events Triggered by Handlers. |
| Baselines |
Shows the percentage distribution of attacks, according to the basic attack scenarios covered by the enabled baselines of baseline protection (see Baseline Protection Wizard):
|
|
Top 10 Attacked Hosts |
Lists the 10 hosts on which the most total number of attacks were identified. The Attack Count column shows the total number (regardless of severity). Only the selected hosts (selection above the charts) are accounted for. |
|
Top 10 Attackers |
Lists the IP addresses from which the most attacks were launched. The Attack Count column shows the total number. |
|
Top 10 Attack Points |
Lists the paths and files on which the most attacks were launched. The Attack Count column shows the total number. |
