Virtual Traffic Manager Analytics
Introduction
Ivanti Neurons for Virtual Traffic Manager (vTM) provides visibility of network activity and service usage across your enterprise through network activity analytics and performance graphs.
After you log in to the Tenant Admin portal, vTM displays the Gateways Overview page. Through the vTM menu, use the Insights menu icon to monitor the vTM Gateways and Clusters, and analyze the gateways performance graphs.
Configuring Export Settings for Transaction Metadata Records
The Ivanti Virtual Traffic Manager maintains a series of long-lived TCP connections to the endpoint, with each connection managed by an internal data-plane process. The data-plane processes handle incoming transactions with the Traffic Manager and stream corresponding metadata records in JSON format, separated by newline characters, to the endpoint.
Use the Transaction Metadata settings at vTM gateway, to configure how the Traffic Manager exports transaction metadata records to the defined endpoint.
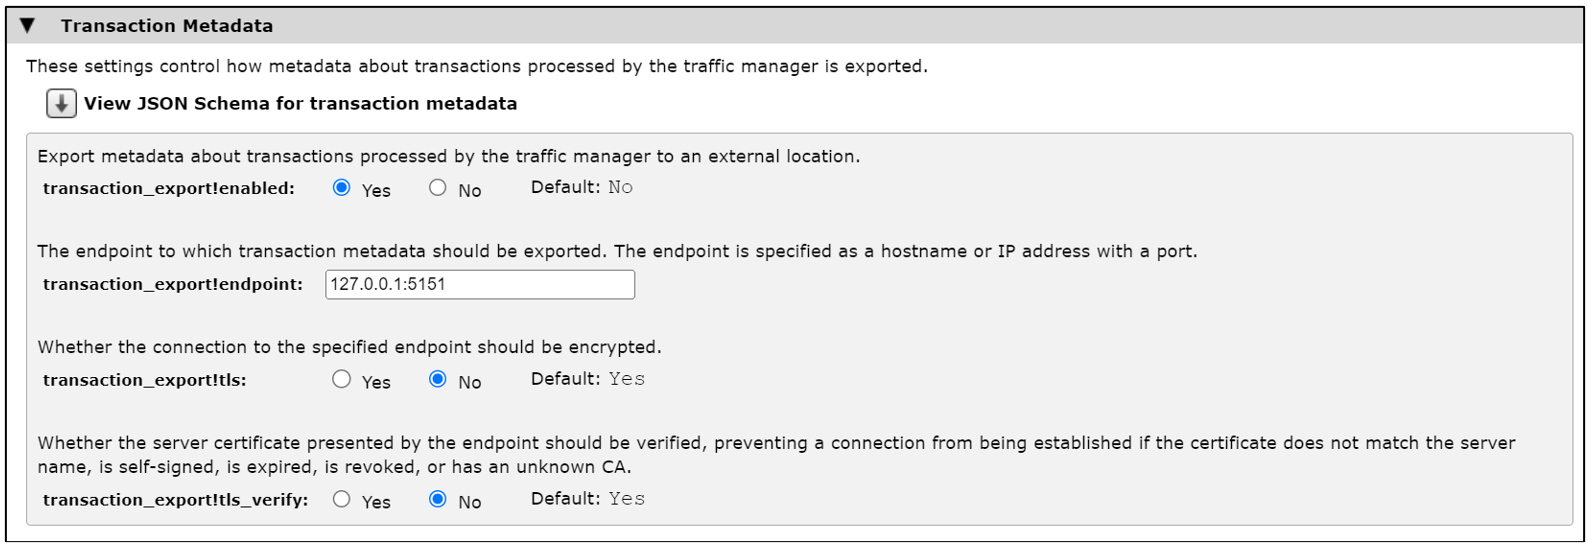
As of now, TLS connections are not supported and all related config items should be mandatorily be set to ‘No’ .
Configuring Export Settings for Log Files
Use the Log Files section at vTM gateway, to configure how the Traffic Manager exports log data to the defined endpoint.
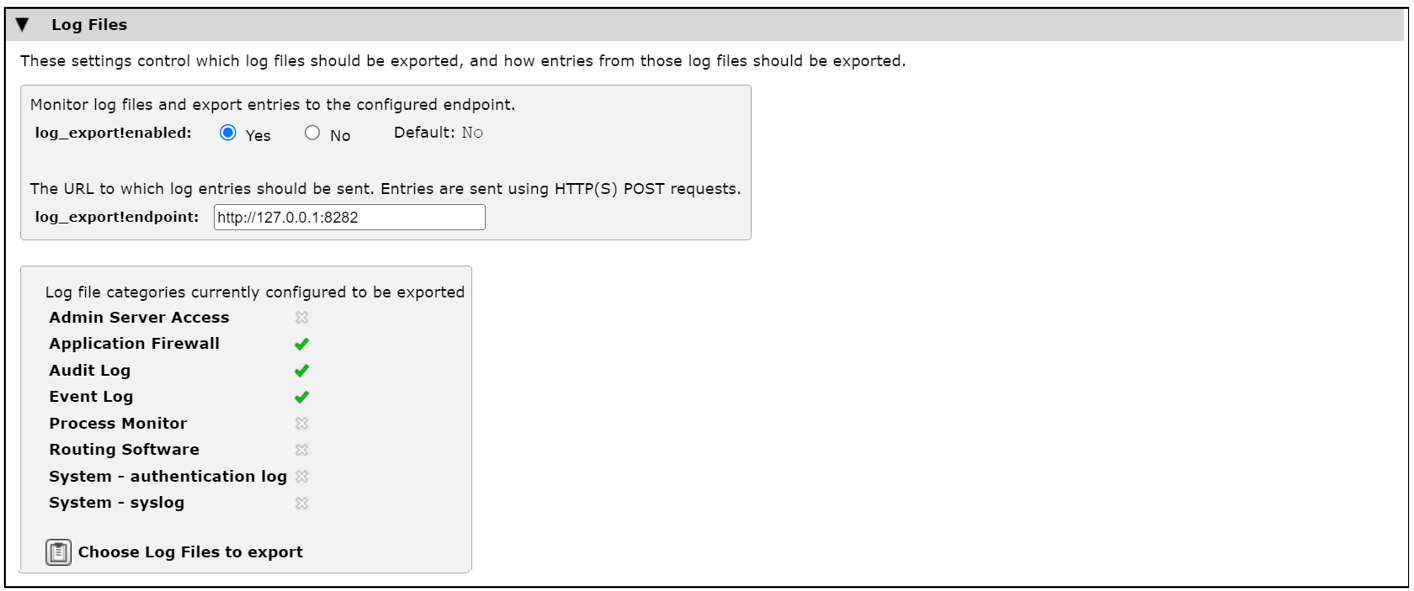
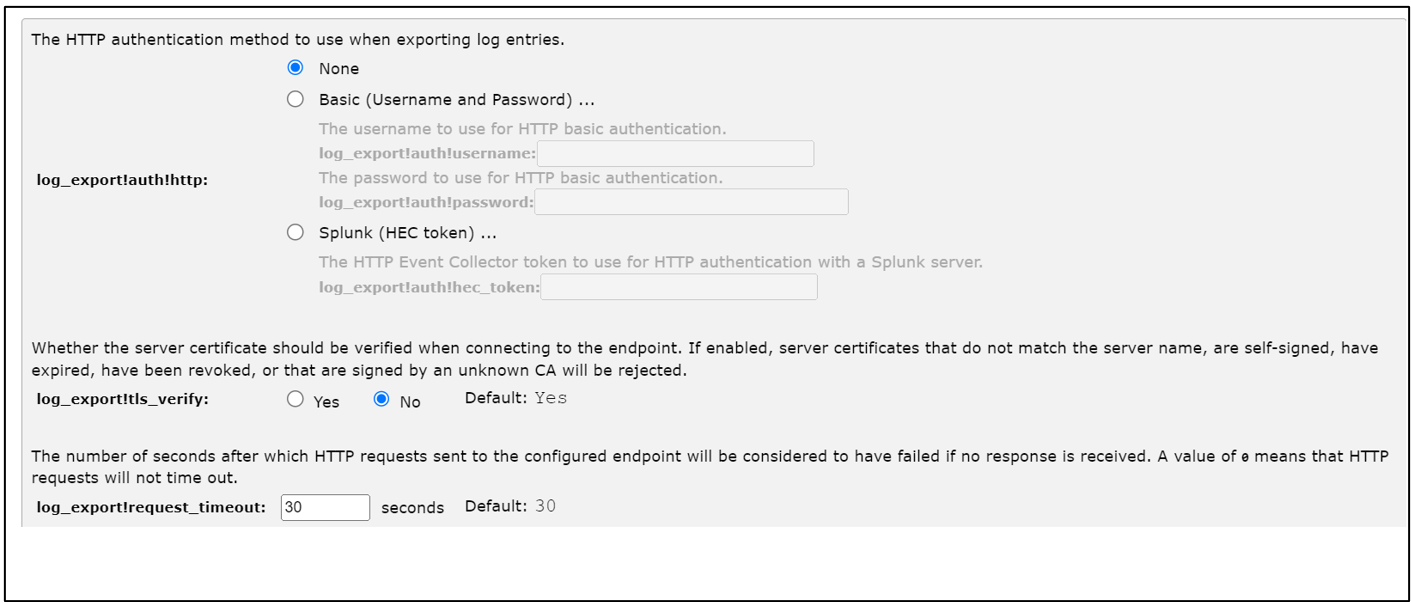
As of now, TLS connections are not supported and all related config items should be mandatorily be set to ‘No’ .
Reviewing Your Network Activity
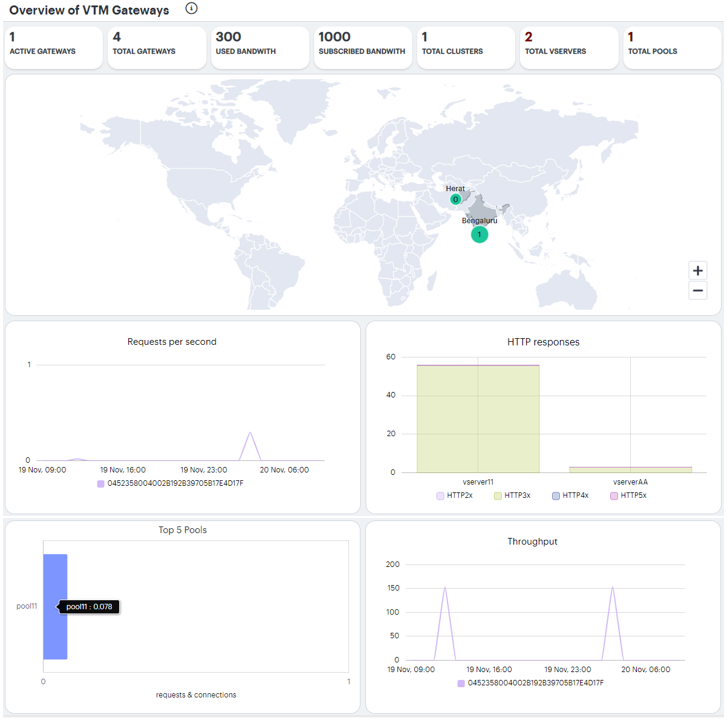
The vTM Gateways overview page shows real-time analytics data for your network infrastructure, providing a one-page dashboard of activity across your organization.
To access the Gateways Overview page:
-
Log into the Controller as a Tenant Admin, see Logging in as a Tenant Administrator.
The Gateways Overview page appears by default.
- To return to the Gateways Overview page at any time, select Insights > Overview from the left-hand menu. Alternatively, select the Ivanti banner at the top.
Understanding the Display
The primary components of the Gateways Overview page are the following:
- Summary ribbon, showing totals for Active Gateways, Total Gateways, Used Bandwidth, Subscribed Bandwidth, Total Virtual Servers, and Total Pools. For details, see Using the Summary Ribbon.
- World map, showing the gateways locations, and each indicated location provides a summary of the activities observed there. Hover your pointer over a counter to view a visual representation of the number of gateways and the bandwidth usage at that location.
Charts, showing the following data:
- Requests per second: For each cluster, the number of requests per second in the last 24 hours.
- HTTP responses: For each virtual server, the number of HTTP responses in the last 24 hours.
- Top 5 pools: For the top 5 pools, the number of requests and connections in the last 24 hours.
- Throughput: For each cluster, the throughput (in mbps) in the last 24 hours.
For a detailed drill-down analysis of each of these primary charts and multiple secondary charts, with filters and time duration, see the section Virtual Traffic Manager Analytics.
Using the Summary Ribbon
The Summary Ribbon at the top of the page shows data totals for each category:
- The number of Active Gateways
- The Total number of Gateways
- The total Used Bandwidth
- The total Subscribed Bandwidth
- The Total number of Clusters
- The Total number of Virtual Servers
- The Total number of Pools
Exploring the Traffic Details
The traffic details page shows charts of various aspects of the traffic. It allows the user to drill-down into the source of the issue.
To view the Traffic Details page, select Insights > Explore.
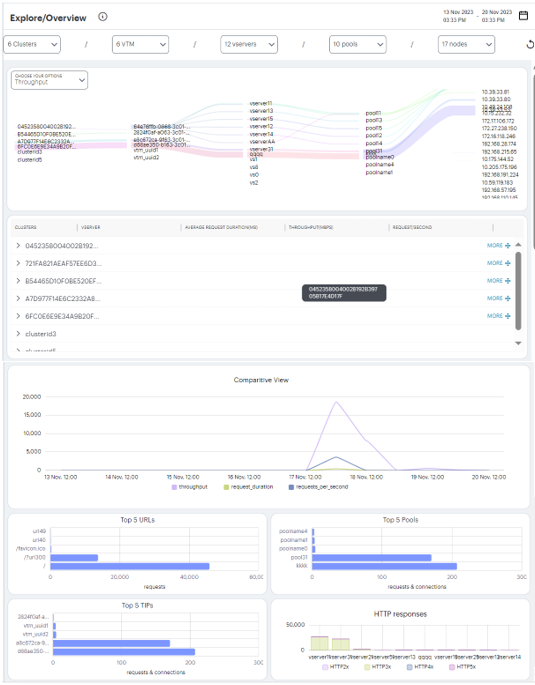
Using the Filter Bar
vTM uses the top part of the Explorer View page to show:
- current page title
- selected Time period and Timezone
- filters based on Cluster, VTM, Virtual Server, Pool, and Node
Set a specific From and To to denote the start and end of your date/time range.
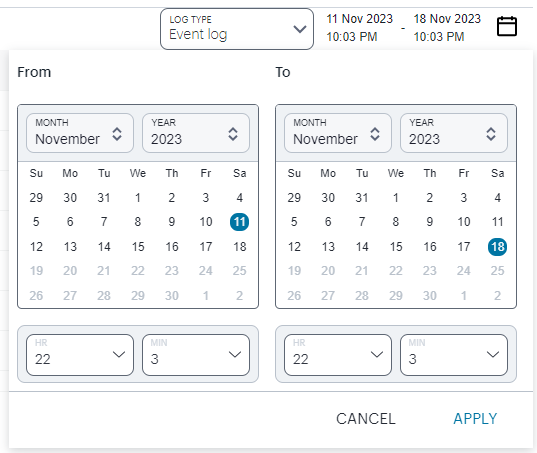
Selecting a date and time range
To return to the current page without making any changes, select Cancel.
To apply your changes, select Apply. The selected time period is displayed in the filter bar and data across all Insights pages is updated accordingly.
Using the Sankey Chart View
The Sankey chart provides an alternate visualization of your services, showing directed flow between related objects based on the option you choose from the drop-down list - Throughput, Requests per second, and Connections per second. The width of each stream in the flow - Cluster > VTM > Virtual Server > Pool > Node - is proportional to the utilization of the object the flow passes through, allowing an administrator to view significant usage and relationships across your user base and infrastructure.
By hovering your pointer over a flow of interest, vTM displays a tooltip confirming the scale of the activity between the two objects connected by the flow.
Using the Clusters Tabular View
The Table view shows all the metrics in a table form. Grouped by cluster, the Table view shows all the three metrics - Average connection duration, Average request duration and Request per second, and Throughput - for each of the vTM instances.
Using the Comparative View
The Comparative View chart allows comparative analytics between two metrics. Multiple metrics can be displayed on this chart (that is, the user shall be able to select requests per second or throughput and plot them side by side).
Using the Charts
The Traffic Details page includes bar charts to provide a breakdown of Top 5 URLs, Top 5 Pools, Top 5 Traffic IPs, and HTTP responses.
Hover your pointer over a particular bar to view a tooltip showing the label and total.
Viewing Logs
The Logs page allows you to watch the Event, Authentication and System logs in real-time as records are appended to them. These events are reported to the Controller by your vTM Gateways.
To view the Logs page:
-
Log in to the Controller as a Tenant Admin, see Logging into the Controller as a Tenant Admin.
-
From the vTM menu, click Insights > Logs.
The Logs page appears.
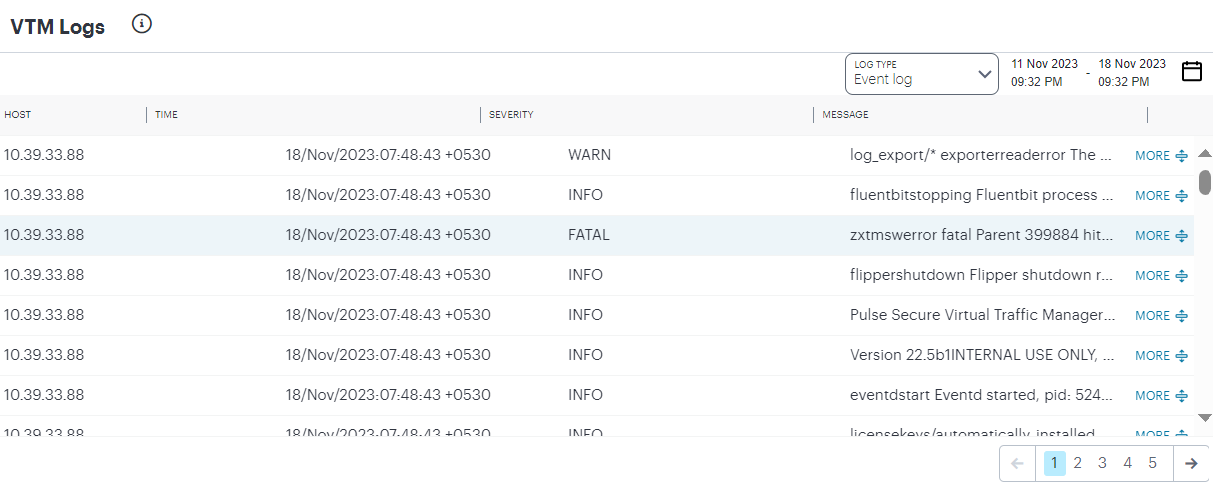
- Click the Log Type drop-down and select Event Log or Other log.
-
Set a specific From and To to denote the start and end of your date/time range.

To apply your changes, click Apply. The selected time period is displayed in the filter bar and data on the page updates accordingly.
To return to the current page without making any changes, select Cancel.