Using the Dashboard
This topic describes the dashboard.
Dashboard Overview
About the Dashboard
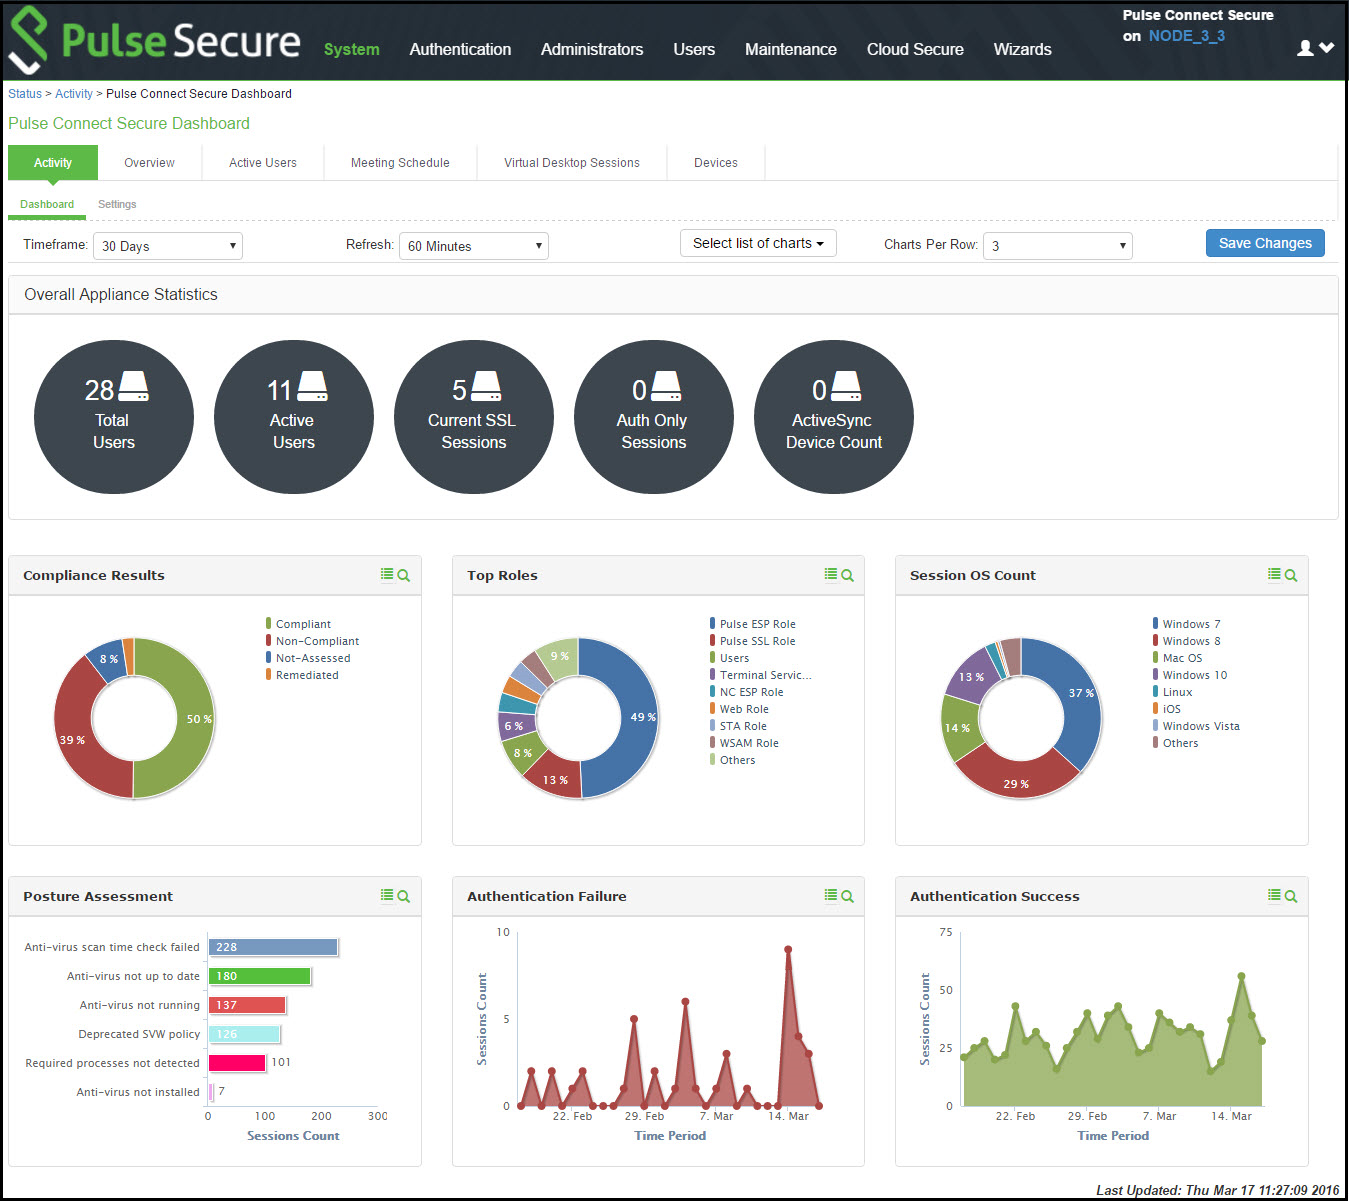
The dashboard contains six default graphic reports focused on security, network activity, application activity, system monitoring, and compliance.
Table describes the dashboard status bar for Pulse Connect Secure.
|
Metric |
Description |
|
Connect Secure |
|
|
Total Users |
The total number of unique users logged in over the past 1, 7, or 30 days. (The count is based on the chart time period setting. The pertinent time period, for example, 1, 7, or 30 days, is shown within brackets along with the number of users.) |
|
Active Users |
The number of unique users currently logged in. |
|
Current SSL Sessions |
The total number of current SSL sessions. |
|
Auth Only Sessions |
The total number of authentication-only user sessions. |
|
ActiveSync Device Count |
The total number of active synchronization devices. |
Table describes the default dashboard charts.
|
Metric |
Description |
|
Authentication Success |
The number of successful authentications over the selected time period (1, 7, or 30 days). |
|
Authentication Failure |
The number of failed authentications over the selected time period (1, 7, or 30 days). |
|
Session OS Count |
Pie chart showing the number of the successful sessions per operating system. |
|
Top Roles |
Pie chart showing the number of top user roles assigned during the selected time period. |
|
Compliance Results |
Pie chart showing Host Checker posture assessment results: Compliant, Not Compliant, Not Assessed, or Remediated. Compliance results are reported for all instances in which Host Checker is run. |
|
Posture Assessment |
Pie chart showing Host Checker policy violations. Policy violations are reported only for instances in which Host Checker is run at initial sign in. |
About the Dashboard Database
The dashboard monitoring service collects and stores data in a database for 30 days. The total number of records stored in the database can be up to 300,000 records.
The dashboard database is created only after enabling the dashboard option. Note that only new sessions are added to the database and changing the Timeframe filter or clicking refresh sends queries to the database. The data is collected only when the dashboard option is enabled.
Table describes the different actions and their results.
|
Action |
Description |
|
Disable and then reenable the dashboard. |
The data collection stops when your dashboard is disabled. |
|
Restore the data from backup, snapshot, or import config. |
The data is not exported, and the data is retained during upgrades. |
Displaying the Dashboard
To display the dashboard, select System > Status > Activity > Dashboard.
Figure shows the dashboard for Pulse Connect Secure.
Selecting a Data Timeframe
To select a data timeframe:
1.Select System > Status > Activity > Dashboard.
2.Select one of the following periods from the Timeframe list box:
•Last 24 Hours - (Default) Refers to the last 24 hours from the current hour.
•Last 7 Days - Refers to current day and the previous last 6 days.
•Last 30 Days - Refers to current day and the previous last 29 days.
Access records are kept for 30 days. Older records are removed and not included in dashboard charts and reports.
Figure shows the dashboard for a timeframe of 30 days.
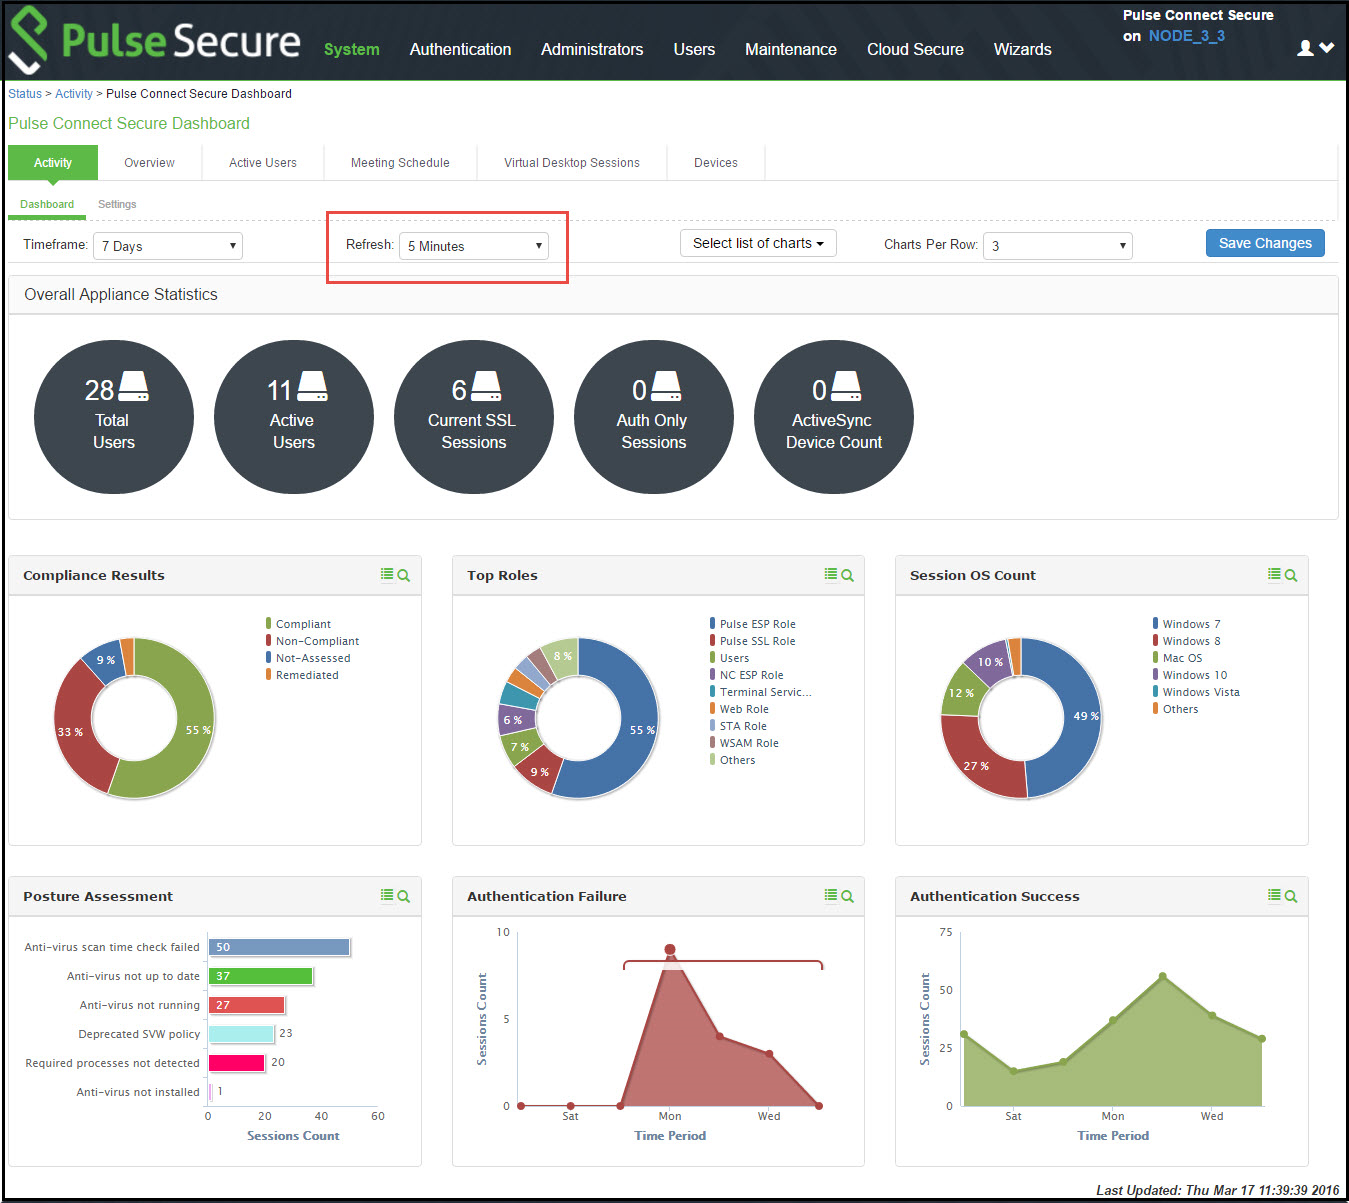
Figure shows the dashboard for a timeframe of 7 days.
Refreshing Data
To refresh data:
1.Select System > Status > Activity > Dashboard.
2.Select one of the following refresh rates from the Refresh list box:
•Disabled
•5 Minutes
•10 Minutes
•30 Minutes
•60 Minutes
Figure shows the dashboard with a refresh rate of 5 minutes.
Drilling Down to Detailed Reports
To drill down to view detailed reports:
1.Select System > Status > Activity > Dashboard.
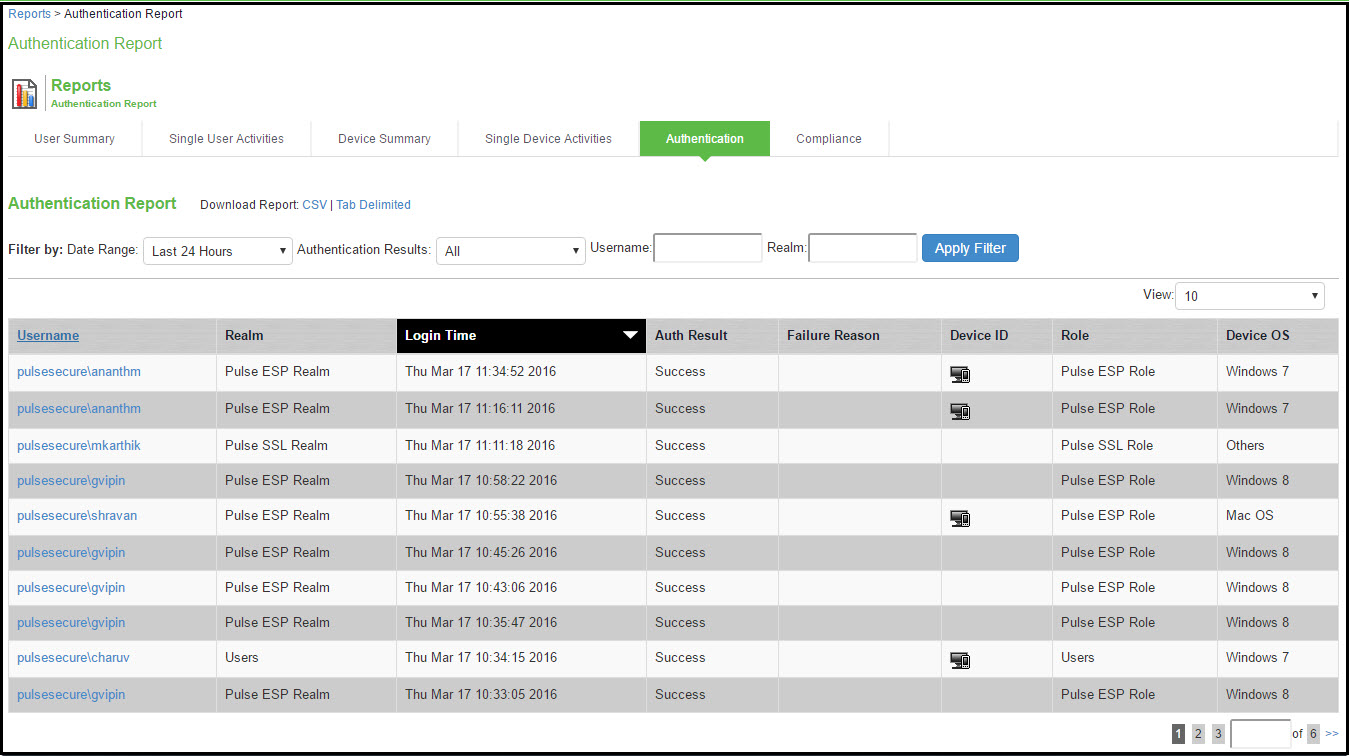
•Click the search icon ![]() to display the corresponding tabular report with predefined search filters.
to display the corresponding tabular report with predefined search filters.
Figure shows the detailed authentication report. The Authentication Results filter is set to Success.


