Using the Dashboard
Dashboard Overview
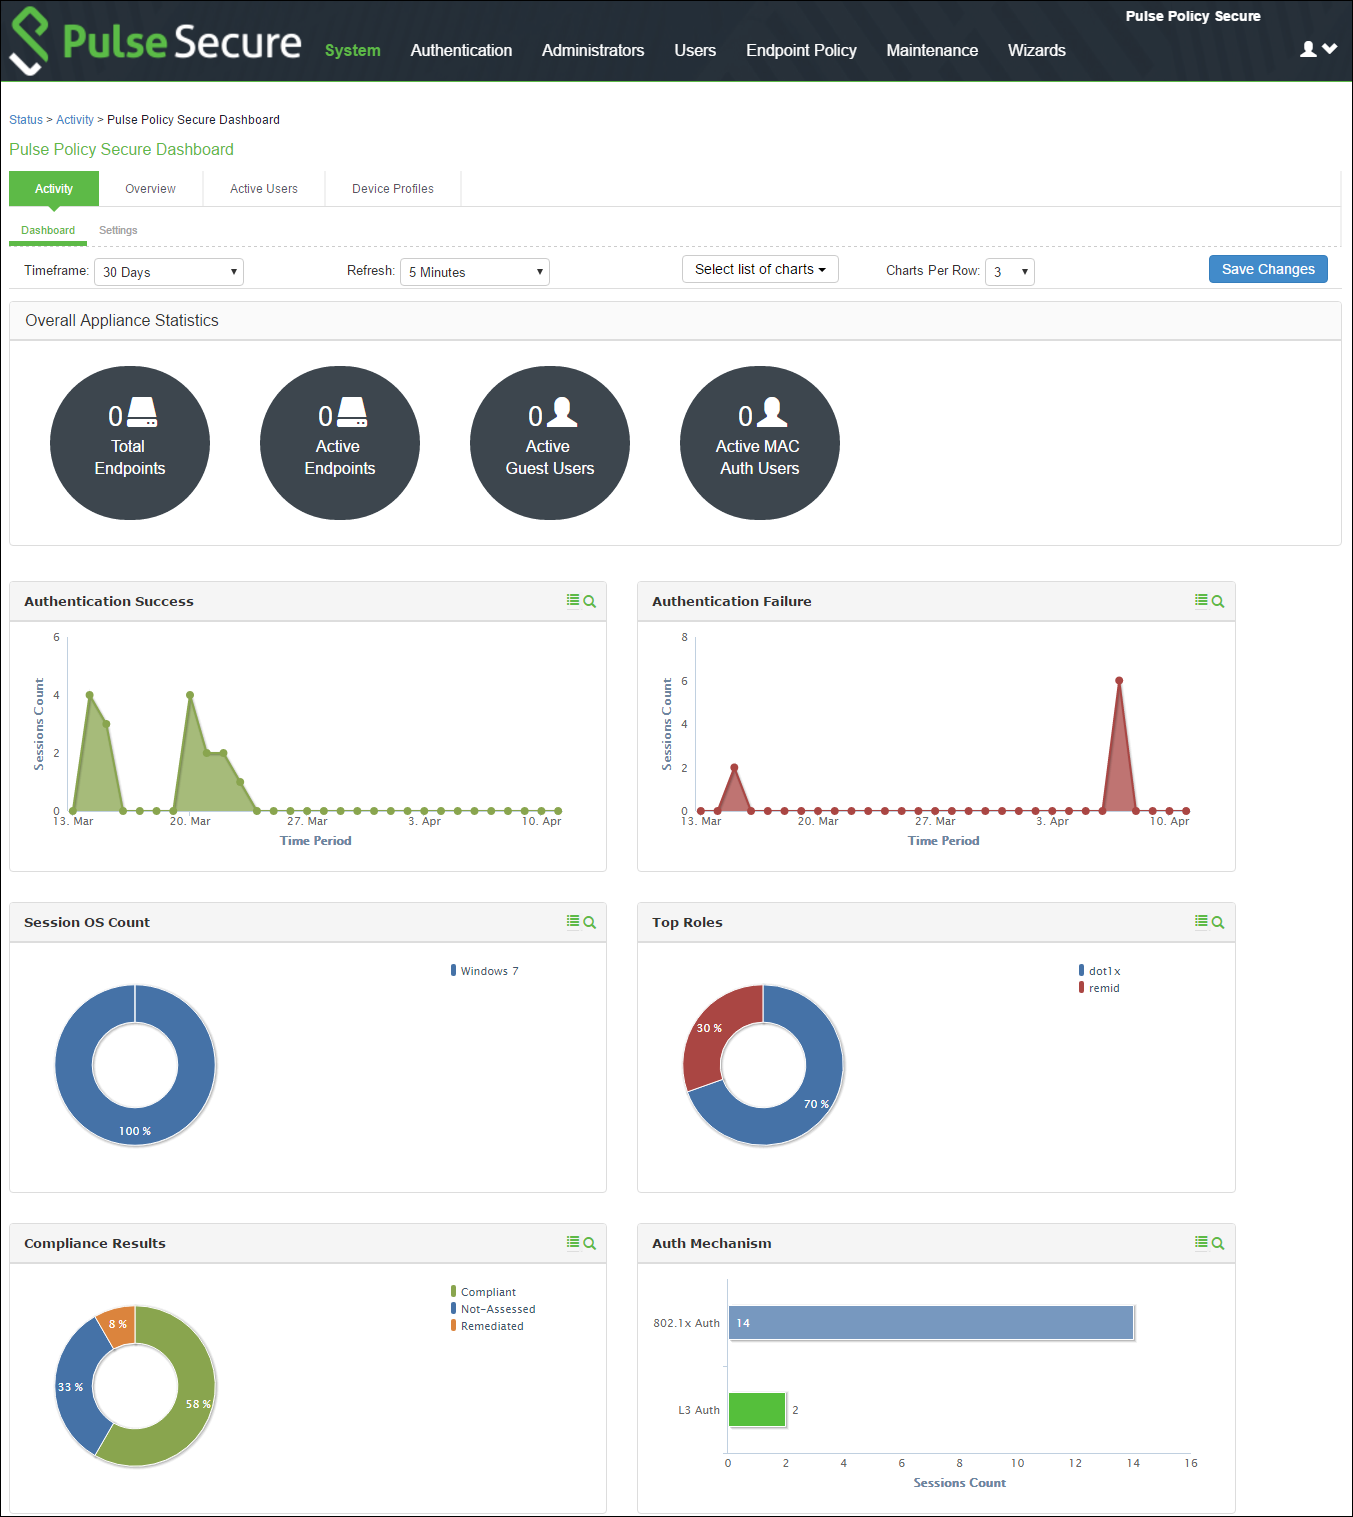
The dashboard contains six default graphic reports focused on security, network activity, application activity, system monitoring, and compliance.
|
Metric |
Description |
|
Policy Secure |
|
|
Total Endpoints |
The total number of unique endpoints over a time. If an endpoint provides a unique identifier (mobile device ID, client ID, and so on), then it will be used to identify the endpoint. For a browser-based session where an identifier is not available, each session is considered a unique endpoint. |
|
Active Endpoints |
The total number of unique endpoints with active sessions. |
|
Active Guests |
The total number of active guest users. A guest user is defined as a user with an expiration date. This includes administrator-created and GUAM-created guest users. This does not include GUAM-created users without expiration dates. |
|
Active MAC Auth Users |
The total number of active MAC authentication users. |
Table describes the default dashboard charts.
|
Dashboard Chart |
Description |
|
Authentication Success |
The number of successful authentications over the selected time (1, 7, or 30 days). The 7-day chart is a bar graph. The 1-day and 30-day charts are line graphs. |
|
Authentication Failure |
The number of failed authentications over the selected time (1, 7, or 30 days). The 7-day chart is a bar graph. The 1-day and 30-day charts are line graphs. |
|
Session OS Count |
Pie chart showing the number of the sessions per operating system. |
|
Top Roles |
Pie chart showing the number of top user roles assigned during the selected time. |
|
Compliance Results |
Pie chart showing Host Checker posture assessment results: Compliant, Not Compliant, Not Assessed, or Remediated. Compliance results are reported for all instances in which Host Checker is run. The posture assessment chart is clubbed with the compliance results chart for PPS. To view the posture assessment chart, select Posture Assessment from the dropdown list. |
|
Posture Assessment |
Pie chart showing Host Checker policy violations. Policy violations are reported only for instances in which Host Checker is run at initial sign in. |
|
Auth Mechanism |
Pie chart showing the number of sessions per authentication mechanism: 802.1x, Layer 3, MAC address. It applies to PPS only. |
Dashboard Database
The dashboard monitoring service collects and stores data in a database for 30 days. The total number of records stored in the database can be up to 300,000 records.
The dashboard database is created only after upgrading to PPS version 5.0 or later and enabling the dashboard option. Note that only new sessions are added to the database and changing the Time Frame filter or clicking refresh sends queries to the database. The data is collected only when the dashboard option is enabled.
Table describes the different actions and their results.
|
Action |
Description |
|
Disable and then reenable the dashboard. |
The data collection stops when your dashboard is disabled. |
|
Restore the data from backup, snapshot, or import config. |
The data is not exported and the data is retained during upgrades |
Displaying the Dashboard
To display the dashboard, select System > Status > Activity > Dashboard.
Selecting a Data Time Frame
To select a data timeframe:
1.Select System > Status > Activity > Dashboard.
2.Select one of the following periods from the Time Frame list box:
•Last 24 Hours– (Default) Refers to the last 24 hours from the current hour.
•Last 7 Days– Refers to current day and the previous last 6 days.
•Last 30 Days– Refers to current day and the previous last 29 days.
Access records are kept for 30 days. Older records are removed and not included in dashboard charts and reports.

Refreshing Data
To refresh data:
1.Select System > Status > Activity > Dashboard.
2.Select one of the following refresh rates from the Refresh list box:
•Disabled
•5 Minutes
•10 Minutes
•30 Minutes
•60 Minutes
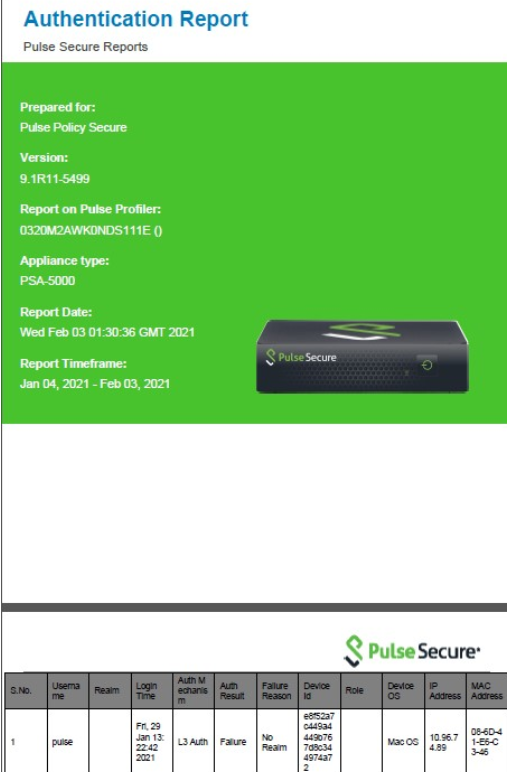
Drilling Down to Detailed Reports
To drill down to view detailed reports:
1.Select System > Status > Activity > Dashboard
2.Click the search icon to display the corresponding tabular report with predefined search filters. For example, enter the filter criteria with the Authentication Results set to Success.
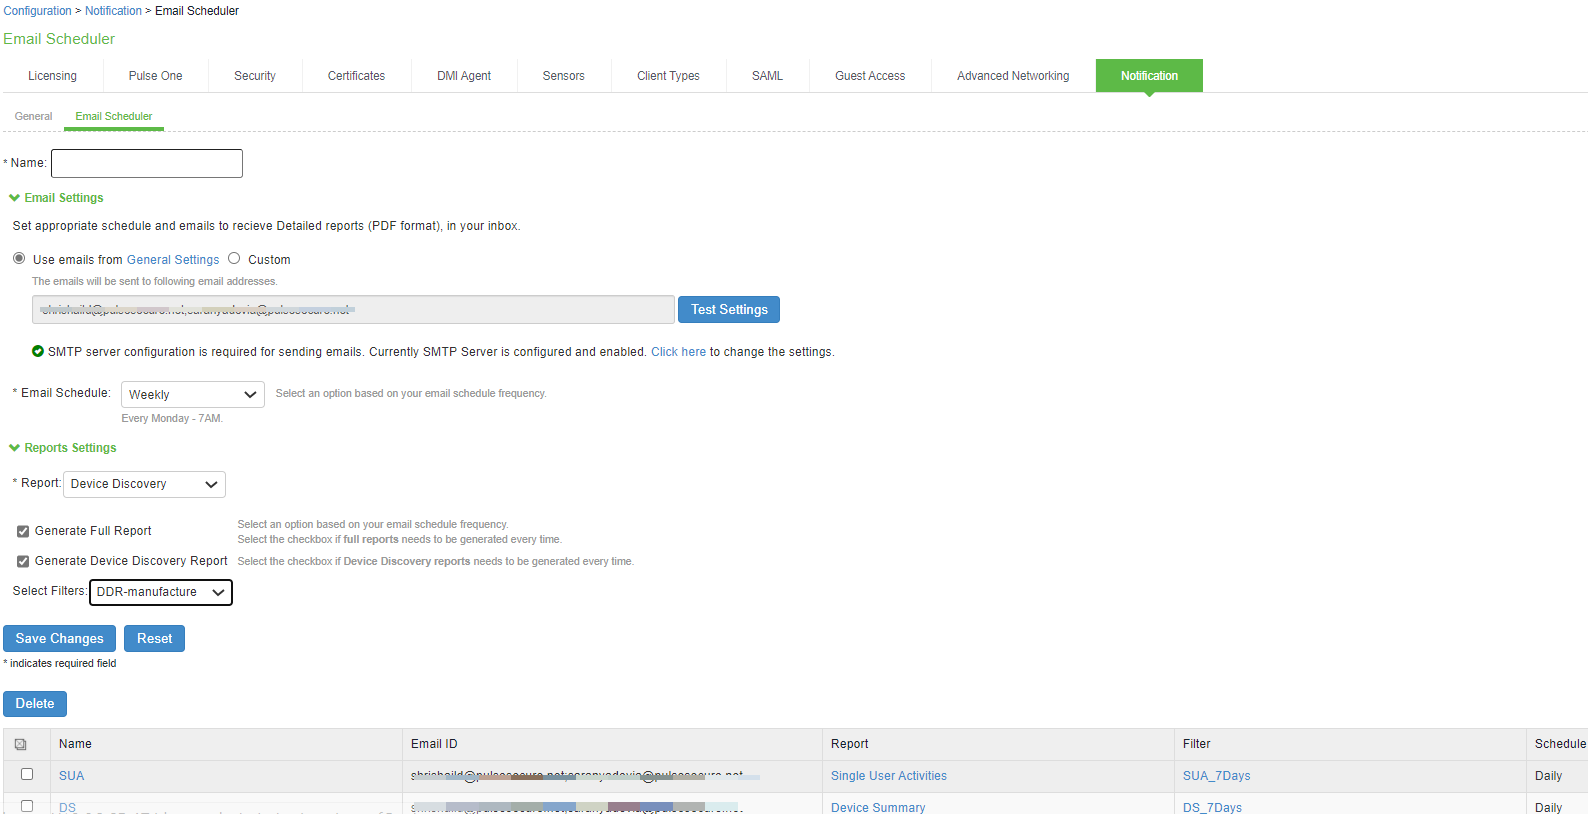
Schedule Report or Email Scheduling
PPS allows you to schedule email notification for sending customized reports. Admin can configure email frequency and select one of the saved filters for getting a customized report.
To schedule reports:
1.Select System > Configuration > Notification > Email Scheduler or Schedule report option in the reports page.
2.Enter the name for the email schedule rule.
3.Under Email Settings, enter the email address either from General Settings or Custom option.
4.Click Test Settings to test the email settings.
5.Configure the email schedule frequency for running the email schedule.
•Daily – Generates reports daily at 7 AM.
•Weekly – Generates reports every Monday at 7 AM.
•Monthly – Generates reports on 1st of every month at 7 AM.
•Custom – Generates reports based on date and time selected.
6.Under Report Settings, select the report type from the drop-down.
7.If Device Discovery Report is selected, the following 2 options appear.
•Generate Full Report- If selected, full (stats) report is generated rather than incremental report. If unselected, Incremental reports are generated based on the email schedule. For example, if Weekly is selected, the reports will be generated based on the last one week activity on the Profiler.
•Generate Device Discovery Report- If selected a filter drop-box appears. Device Discovery Report is generated along with the Profiler statistics in PDF format. If unselected, only Profiler statistics will be sent.
8.Choose the desired filter. See Creating a new Filter section for information on how to create filters. The corresponding saved filters gets populated automatically.
9.Click Save Changes.
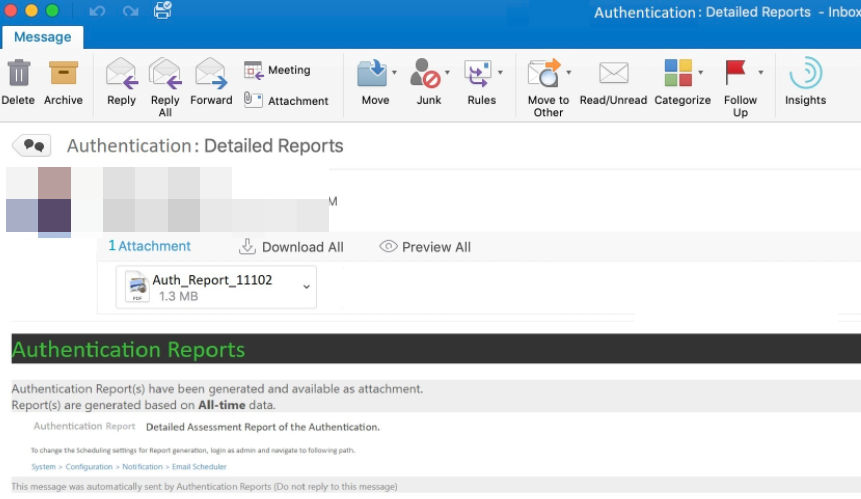
The newly created email rule gets listed in the email rules table. The reports will be generated based on the selection and emailed. The existing email schedule can also be edited or deleted based on your requirement.
The scheduled email reports will be sent based on PPS server time.
Only one email schedule can be configured for one report at a time.