Application Statistics
Purpose
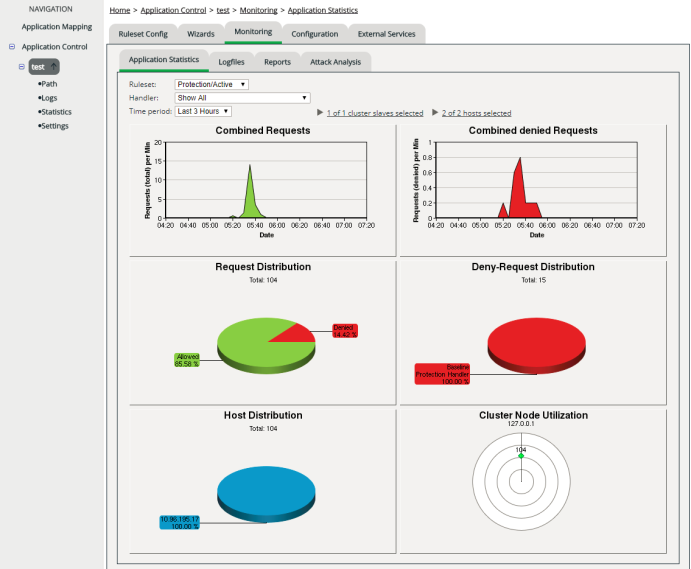
Graphical displays of statistics show the distribution of accepted and denied requests according to the time and the individual handlers.
Each set of statistics refers to a specific application and to a specific ruleset (either protection ruleset or detection ruleset).
If the statistics function has been deactivated in the Global Configuration, there aren’t any application statistics data available.
Opening
Information displayed
| Diagram | Meaning |
|---|---|
|
Combined Requests |
Distribution of all requests (accepted + denied) across the selected period of time for all hosts of the application. |
|
Combined Denied Requests |
Distribution of the denied requests across the selected period of time for all hosts of the application. |
|
Request Distribution |
Percentage distribution of the accepted requests in comparison to the denied requests. |
|
Deny-Request Distribution |
It depends on the selection made within the Handler selection list what's shown here: •If the entry Show All is selected, the chart shows the percentage distribution of the denied requests, relating to the individual handlers (see Handlers). •If the entry InvalidArgsHandler is selected, the chart shows the percentage distribution of requests that were denied because they matched the blacklist compared to those denied because they didn’t match the whitelist. •If the entry BaselineProtectionHandler is selected, the chart shows the percentage distribution of denied requests according to the different attack scenarios covered by the activated baselines. •If any other handler is selected, no data is shown. |
|
Host Distribution |
Percentage distribution of all requests, relating to the individual hosts of the application. |
|
Cluster Node Utilization |
Number of requests, relating to cluster nodes. |

