Detailed information about users
Besides the basic information that is displayed in the overview, you can gather detailed information about a specific user by double-clicking this user or by clicking Analyze from the Action > Workspace Analysis menu. The analysis is based on:
-
whether the user's current identity meets the Access Control Identity rules currently set for an application or setting (such as OU and group memberships and Administrative Roles).
-
whether the actual date and time of the computer on which the Console user is currently running the Workspace Analysis meets the Date and Time rules set for the application or object.
-
whether the computer on which the user logged on most recently, met the Locations and Devices rules and the Workspace Control rules currently set for the application or setting.
The Workspace Analysis Details window contains detailed information about the user's settings.
It is more or less grouped in the same manner as the tree in the Management Console:

User Context
-
Locations and Devices: The accessible Zones are based on the client and server that were used when the user last logged on to a Workspace Control session.
-
Account properties: All properties of the selected user's account. This contains all information that is available in the "basic" Workspace Analysis, plus account expiration date, e-mail address, last successful authentication, LDAP user entry, assigned Administrative Roles, (in)direct membership, OU information.
-
Workspace Containers: The Workspace Containers that are currently active for this user.

Composition
 The Applications section contains the following information:
-
Applications: All applications that the user has access to, plus who authorized access to the application (if applicable).
-
File Types: The File Types configured for this user. That is, for which available applications file associations have been configured.
-
E-mail Settings: E-mail Settings that are attached to applications to which the user has access. E-mail Settings that are not attached to an application, but that do belong to the scope of the user, will not be displayed.
-
Data Sources: The Data Sources that are attached to applications to which the user has access. Data Sources that are not attached to an application, but that do belong to the scope of the user, will not be displayed.
-
The Actions By Event section contains information on all of the user's Actions, grouped by the session event that triggers them and listed in the order of execution:
-
At logon: May contain actions for Environment Variables, Folder Redirection, Automation Tasks, Microsoft ConfigMgr, Execute Command, Drive and Port Mappings, Drive Substitutes, Printers, User Home Directory, Folder Synchronization, User Registry and User Profile Directory
-
At Session Refresh: May contain actions for Folder Synchronization and Execute Command.
-
At Session Reconnect: May contain actions for Folder Synchronization and Execute Command.
-
At Logoff: May contain actions for Folder Synchronization and Execute Command.
The Actions By Type section contains the following information:
-
Automation Tasks: An overview concerning the user's Automation Tasks.
-
Environment Variables: An overview of the user's Environment Variable Actions.
-
Execute Command: An overview of the user's Execute Command Actions.
The Files and Folders section contains the following information:
-
Drive and Port mappings: An overview of the user's Mappings. The last logon is used to determine which language should be used when showing language-based settings.
-
Drive Substitutes: An overview of the user's Drive Substitutes.
-
Folder Redirection: An overview of the user's Folder Redirections.
-
Folder Synchronization: An overview of the user's Folder Synchronizations.
-
User Home Directory: An overview of the user's Home Directory Actions.
-
User Profile Directory: An overview of the user's Profile Directory Actions.
-
LANDesk: An overview concerning the user's LANDesk software distributions.
-
Microsoft ConfigMgr: An overview concerning the user's Microsoft ConfigMgr Distributions.
-
Printers: All configured Network Printers for the user.
-
User Registry: An overview of the user's Registry Settings. When viewing the user's registry settings, double-clicking End result (at the bottom of the Type column) will merge all configured registry settings and show the end result in the Registry Viewer. To track registry values, the source is shown on the right.
- User Settings: All configured User Settings for the user.
- When clicking View stored settings for a User Setting, User Settings for files that contain Unicode or non-Western characters in their name, are displayed with the following text: <File name contains non-displayable text and formats>.

Security
The Applications section contains the following information:
-
Managed Applications: The Applications log for the specific user provides an overview of the applications that were blocked for this user.
-
User Installed Applications: All User Installed Applications (if applicable).
-
Websites: The websites log for the specific user provides an overview of all blocked attempts to access websites for this user.
The Data section contains the following information:
-
Removable Disks: The Removable Disks Access for the specific user provides an overview about the user's access to removable media. The log provides an overview of all blocked attempts to access a removable disk for this user.
-
Files and Folders: The Files and Folders log for the specific user provides an overview of the files and folders that were blocked for this user.
-
Read-Only Blanketing: The Read-Only Blanketing log for the specific user provides an overview of all blocked attempts to access a drive that is rendered read-only for this user.
-
Network connections: The Network Connections log for this user provides an overview of all blocked network connections for this user.
-
User Sessions: The User Sessions log provides a detailed list of all Sessions security events for this user.

Diagnostics
-
User sessions: A list of the user's active sessions. Right-click a session in this list to force a refresh of the session, remote control the session, etc.
-
Workspace Model Overview: An overview of the mode in which each Workspace Control feature is running, including information about any Workspace Container exception that applies to the user.
-
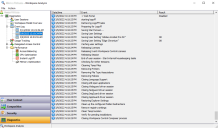
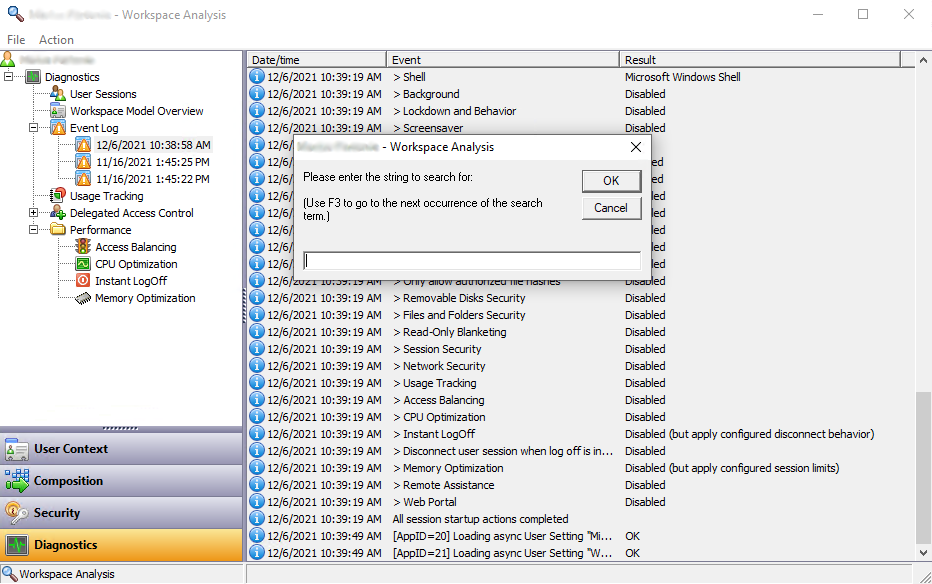
Event Log: A log of all Action settings that were processed for this user. The Event Log can be used to find problems with a user's settings.
 Search Event Log
To search event logs for a specific event, use one of the following methods:
-
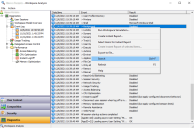
Select an event log or select any log entry in the right-side pane, and then press CTRL + F.

Use F3 to continue the search and find the next occurrence of the searched criteria.
-
Select an event log and then in the main menu, select Action > Search.
-
Right-click on an event log in the left-side navigation menu, or right-click on any log entry in the right-side pane, and then select Search from the context menu.
Export Event Log
To export event logs as CSV files, use one of the following methods:
-
To export all event logs:
-
Right-click on the Event Log node in the left-side navigation menu and then select Export to file from the context menu. Select the location where to save the CSV files and select OK.
-
Select the Event Log node in the left-side navigation menu and then in the main menu, select Action > Export to file. Select the location where to save the CSV files and select OK.
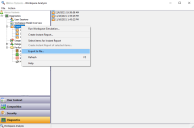
Each individual event log is exported as a separate CSV file.
-
-
To export specific event logs:
-
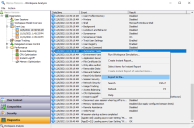
Right-click on a specific event log in the left-side navigation menu and then select Export to file from the context menu. Select the location where to save the CSV file and select OK.
-
Select a specific event log. Right-click on any log entry in the right-side pane and then select Export to file from the context menu. Select the location where to save the CSV file and select OK.
-
Refresh Event Log
To refresh event logs, use one of the following methods:
-
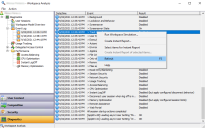
Select an event log and press F5.
-
Select an event log and then in the main menu, select Action > Refresh.
-
Right-click on an event log in the left-side navigation menu, or right-click on any log entry in the right-side pane, and then select Refresh from the context menu.
Logoff Events
The Event Log show logoff events that occur when user sessions are terminated. When the Workspace Control managed session is closed on a Workspace Control Agent, the events associated with the session logoff process are written to the event log for that session.
-
-
Usage Tracking: Double-click the Details pane to open the Usage Tracking viewer for the selected user.
-
Delegated access control: The applications of which the user is an application manager. Selecting an application displays all details of the delegated application (users, capacity in use, etc.).


-
The Performance node contains the following information:
-
Access Balancing: The Access Balancing log provides a detailed list of all Access Balancing events for this user.
-
CPU Optimization: The CPU Optimization log provides a detailed list of all CPU Optimization events for this user.
-
Instant LogOff: The Instant LogOff log provides a detailed list of all Instant LogOff events for this user.
-
Memory Optimization: The Memory Optimization log provides a detailed list of all Memory Optimization events for this user.
-
When your Workspace Control environment contains a Relay Server, situations may occur in which the Event Log of certain users has not been updated, because this happens asynchronous. As a result, the Event log may contain an error that a file is missing. This is intended behavior of Workspace Control. The error will disappear again when the Relay Server has processed all data and the Event Log has been updated. The Event Log is available when viewing the detailed Workspace Analysis of a user at Diagnostics > Workspace Analysis.
You can minimize the Workspace Analysis Details window to the Taskbar, which allows you to browse the Management Console while still having quick access to the Workspace Analysis overview for the selected user.