Event Viewer
Introduced in Application Control 2021.1, Event Viewer is a powerful query tool that allows you to view, group and filter or search events and then use events identified to modify or create configuration rules using simple drag or copy gestures. Event Viewer queries are based on event types, and can be easily customized to focus on specific time periods, users or machines and then filtered or searched to identify specific event attributes.
Videos
Application Control - Even Viewer
Application Control - Event Viewer Privilege Discovery Use Case
Knowledge Base Articles
Please see Application Control Landing Page Configuration Best Known Methods for further information. You will need to be logged into the Ivanti
In this section:
The typical use case for the Event Viewer is to review audit data on an iterative basis at the initial setup of Application Control and modify the configuration accordingly. It is also valuable for specific queries in response to user requests or operational requirements. Performing such reviews periodically can help ensure your configuration remains fit for purpose and meets the requirements of users across your organization.
The following videos provide an introduction to Event Viewer feature:
Example use-case: Privilege Discovery (4m)
The Event Viewer tool is available only for Ivanti, Inc. Management Center (MC) users, that is, where Management Center is used to collect event data.
Users will need to upgrade to the latest versions of both Application Control and the MC to ensure event viewer data is returned as expected.
To enable analysis of queries offline, results can be saved to a file and subsequently shared, opened and modified - without having to establish or maintain a database connection (2021.3 and later).
For a list of Application Event IDs recorded in MC, refer to the Available Events (see also Help Desk Portal Request Logging.
Create query
-
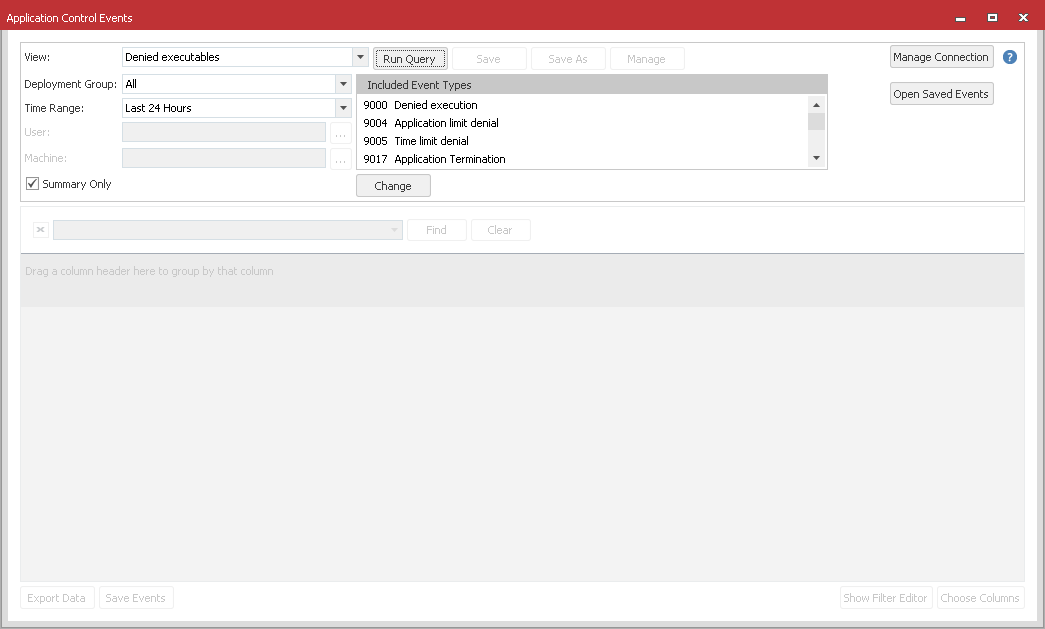
From the console ribbon, select Manage > Event Viewer.
The Application Control Events dialog is displayed.
Connection details are the same as those used by AppSense in Enterprise mode to store and deploy configurations via Ivanti Management Center. If you have previously saved a database connection, details will be saved as part of your user profile and listed here. To add or modify an MC connection see Create MC connection: below.
-
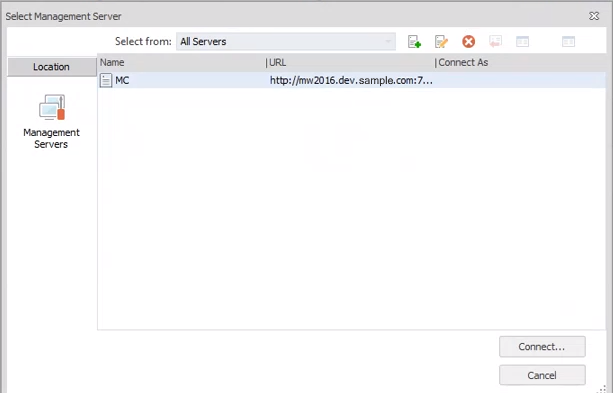
From the Select Management Server dialog, click the connection required or select the connection and click Connect.
The user connection dialog opens.
-
In the user connection dialog select the options required:
Connect as
Current User - Select this option to connect using your current user profile.
Custom User - Select this option to connect using an alternative user profile.
Note that to access the MC the user profile you select must have required database access permissions.
Remember me - Select or clear this checkbox as required.
When complete, click OK to save connection credentials.
With connection details entered, the user connection dialog will close and the connection is established.
-
In the View field click the arrow icon and select the view required from the list.
The list comprises preconfigured views plus any customized views you have saved previously.
Each view represents a category of event(s) you can query and will return results based upon the corresponding event IDs.
Preconfigured views include:
-
Denied Executables
-
Allowed Executables
-
Policy Change Requests
-
Policy Change Executables
-
Privilege Management
-
Privilege Discovery
-
Privilege Discovery (Windows Executable Components)
-
Self Authorization
-
Self Elevation
-
UAC Replacement
-
Browser Control
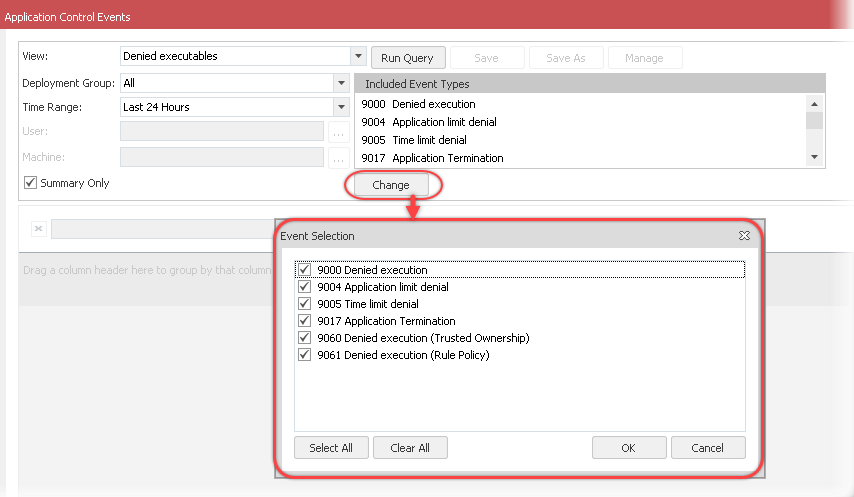
The majority of views return only single event types. For example, Privilege Management lists when application privileges are changed (event ID 9018). Other views return a number of event types. Denied Executables for example, displays events recording denied execution, application limit denial, time limit denial, application termination, denied execution (using trusted ownership), and denied execution (using rule policy).
Change event types included
Where multiple event IDs are included administrators can modify and reduce the list if required (Application Control 2021.3 ):
-
Select Change. The Event Selection dialog is displayed, it lists all events included in the view.
-
Select or clear the checkbox for each event as required, then click OK.
Note that certain queries are likely to return a large amount of data and can take considerable time to run - especially if your database is very large. It is strongly recommended you constrain such queries using filters such as Time Range, Deployment Group, User or Machine, and select Summary Only where applicable.
-
In the Deployment Group field click the arrow icon and select the group required from the list. The deployment groups listed are those defined in MC at the time of your database connection. Note that if you have added or deleted groups in your current session, reconnect to the MC to update the groups listed.
-
Select the specific deployment group required. Alternatively select :
-
All - returns events from all deployment groups defined
-
(Default) - returns events from the default deployment group -as defined in the MC
-
-
In the Time Range field click the arrow icon and select the period required from the list.
Alternatively, select <Specify custom period> and in the Custom Time Range dialog, specify a start and end time for the time range required then click OK.
-
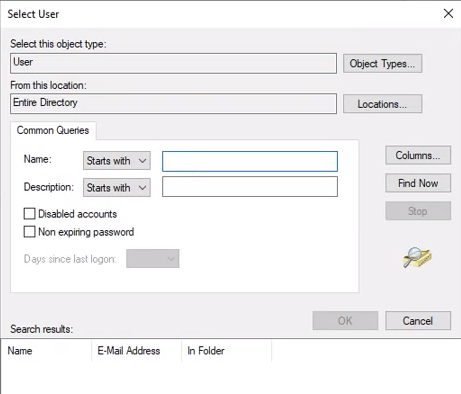
If required, click the ellipses next to the User field, and select (or specify) the user required from the Select User dialog, then click OK.
Event Viewer queries filtered for specific users allows you to troubleshoot and address reported user issues or requests. Adding a time range for your query allows highly specific results. The query will return only the events raised for the user and time range required.
To specify the user required, enter the exact match comprising the domain and user name. For example, ivanti/example.username
Select user
Note, the User field is not available if the Summary Only checkbox is selected.
-
In the Select User dialog, click Advanced... to expand the dialog:
-
In the Common Queries panel, enter a search term in the Name and/or Description field then click Find Now.
Matched results are listed. -
Select the user required and click OK to confirm.
-
If required, click the ellipses next to the Machine field, and select the machine required. Alternatively, enter an exact match for the machine domain and name directly.
The Machine field is not available if the Summary Only checkbox is selected.
-
Select or clear the Summary Only checkbox as required.
The Summary Only option groups similar events and provides total occurrences and user counts for all instances identified. This data allows an administrator to see immediately which events are recurring and/or by how many users. For example, it identifies files that have been blocked most frequently, or applications that have been allowed. The Summary Only view ignores user and machine-specific data, providing numbers of instances only. It is available for allowed and denied executable queries only.
With the Summary Only option cleared, the query will return all event data as a simple grid without values for total or user count.
-
To run the query, select Run Query.
Results are listed and can be reviewed. If you make changes to the View or filters you must re-run the query to update the results.
Environment variables
Application Control normalizes absolute file paths for executables identified in events. It substitutes standard environment variables for certain user or machine-specific values. This means that when the same file is accessed by different users and/or on different machines, the normalized path shows this as identical.
Example:
|
Absolute paths |
Normalized path |
|---|---|
|
C:\ProgramData D:\ProgramData |
%programdata% |
|
C:\users\test\desktop\test.exe |
%userprofile%\desktop\test.exe |
-
From the Select Management Server dialog, click the Add icon.
The Add Server dialog opens. -
In the Add Server dialog, enter connection details for the MC:
Note, these details are determined when the MC is configured. Refer to About Management Center, or to your system administrator.
Friendly name - the 'friendly' or more descriptive name for the server required.
Select Server
Protocol - select http or https.
Server name - enter or select the MC server name.
Port - the port used for connections to the MC.
Full URL - the full URL for the MC server.
-
When details are entered, click Add.
The connection is saved and listed in the Select Management Server dialog.
Customize query results displayed
Once you have run the query you can tailor how your results are displayed, save your customized view and export results.
Configure display
The results section of the Application Control Events dialog is configurable.
-
Group results - example by column header. Drag a column header into the top of the results table. This action will group your returned results according to the column header selected.
-
Use theSearch results - example tool to include only those events that match your search criteria. The search applies to all columns. Criteria could include file names or extensions, user or machine names for example. In the case of the Denied Executables query, where a number of event IDs are returned, you could search for a particular event ID, for example.
-
Apply Filter columns - example to one or more column headers. This allows you to include OR exclude events that match your criteria.
Click Show Filter Editor to add filters to the query results. Alternatively, mouse-over a column header then click the filter icon.
The Filter Editor dialog opens, allowing you to specify the filter criteria required.
See, the Privilege Discovery use-case video for an illustration of creating and applying a filter.
-
Click Choose Columns to customize which columns display in the query results.
-
Reorder the columns by clicking and dragging the column headers to new locations.
-
Click within a column header to sort the column in ascending or descending order.
The results table header includes the text: Drag a column header here to group by that column.
-
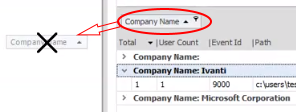
To group your query results, select the column header required and drag this to the header row within the dialog.
-
Results are grouped according to the column header applied.
In this example shown below, results are grouped according to Company Name. -
Further grouping can be applied if required to build a structured listing of results.
The grouping structure is indicated within the table header.

Ungroup
-
To remove a grouping, select it in the table header row, then drag and drop the selection to the required location:
-
move to a column header to ungroup and retain column in your returned results.
-
move anywhere outside of the Events Viewer dialog to ungroup and remove the column from the query results.
Note if you remove the column header in error, you will need to re-run the query.
-
To initiate a search, enter the text you want to find into the search bar, then click Find. Events matching the search criteria are displayed; all other events are hidden.
If the Search field is not visible, right-click on a column header in the Results view and select Show Find Panel from the context menu.
Tips for the Event Viewer search tool
-
The Search tool works only on the information currently visible.
You can right-click on the column headers to add or remove columns to be searched. -
If a filter has been applied, only updates matching both the search criteria and the filter criteria are displayed.
-
All partial matches are displayed.
-
The search is not case sensitive.
-
The use of wildcards is not supported.
-
Click Clear to clear the search criteria.
Click Show Filter Editor or mouse-over a column header then click the filter icon. Alternatively, right-click the column required and select Filter Editor from the context menu.
-
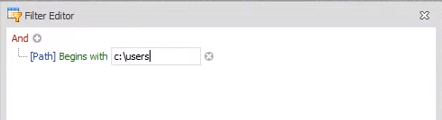
In the Filter Editor dialog, enter the criteria required.
In the example shown, we create a filter to show only those where the path beginsC:\users
-
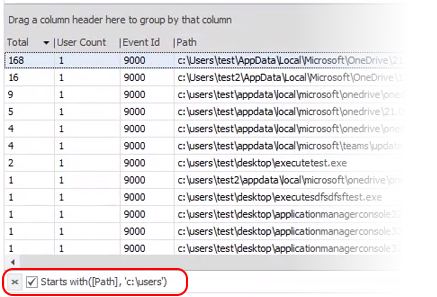
When you have specified your criteria click OK.
Alternatively, click Apply to view the filter results and then click OK when you wish to proceed. -
The filter is applied to your returned results and the criteria is displayed.
-
To remove the filter, clear the filter criteria checkbox.
Save and manage custom queries
Modifications can be saved as a custom query enabling you to retain the changes made, revisit and re-run the query as required. Saved custom queries are available for selection from the list of views (refer to the View field).
-
Click Save to save any changes you have made to a custom query.
-
Click Save As to save your current custom query with a unique name. Note, you must first run the query to activate the Save As option.
-
Click Manage to display the list of all custom queries. The Manage Views dialog allows you to select a query and then rename or delete it.
Export data
Query results can be exported in CSV format.
Select Export Data and choose the option required:
-
Export current view with selected columns - exports only the current customized view.
-
Export current view with all columns - exports all returned query results.
Offline Event Viewing (2021.3 and later)
Query results can be saved to an AC events file (.acevents) to enable offline event viewing and editing. The file can be shared and the data reviewed and modification without having to run a query again and without having to establish or maintain a database connection.
Save events
To save events to an AC events file:
-
Select Save Events.
-
In the Save As dialog, navigate to the folder location required, enter file name, then select Save.
View saved events
To open and view an AC events file:
-
From the Application Control Events dialog select the button: Open Saved Events.
-
In the Open dialog, navigate to the folder location required, select the file name required, then select Open.
The .acevents file opens in a new dialog.
Edit saved events data
Data can be filtered, edited and used to modify or create configuration rules.
For a description of the functionality available, refer to Modify configuration rules following.
Modify configuration rules
The Event Viewer runs in a separate window to the Application Control console. This enables users to drag (or copy and paste) items from the viewer to the console and immediately modify or create the rules required.
Events listed can be dragged and dropped or copied and pasted to create File Path, File Name, Folder or File Hash Rule Items for the following:
-
Rule Collections
-
Rule Sets > Executable Control > Allowed/Denied
-
Rule Sets > Privilege Management > Applications/Self-Elevation
Having run your query and reviewed results:
-
Open the Application Control console and in the Configuration navigation pane, expand Rules and select the configuration rule required.
-
In the Event Viewer dialog, select the event required and either copy or drag the item to the configuration dialog.
Note that if required, multiple events can be selected and added to the configuration. -
The Select Rule Item Type dialog is displayed.
Select the rule type required:-
File Path - copies the full path of the file from the event ID. Applies to file rules.
-
File name - copies the file name from the event ID. Applies to file rules.
-
Folder - copies the folder name and path from the event ID. Applies to folder rules.
-
File Hash - copies the file hash from the event ID. Applies to signature rules.
-
-
The rule item is immediately added to the configuration.
-
If the item added is a file or folder you can view and/or edit its properties and metadata to ensure inegrity.
Double-click the newly added item to open the Edit dialog, or right-click the item and select Edit.
Note that by default metadata is not enabled for items added via Event Viewer. Click the Metadata tab in the Edit dialog and select the checkbox(es) for the data required. The relevant data is immediately displayed. For further information see Metadata.
Add an allowed item
Using Event Viewer, you identify a recurring event of a file that has been Allowed by many users and you want to make it available to all users:
-
Open the Application Control console and in the Configuration navigation pane, select Everyone > Allowed Items.
-
In the Event Viewer dialog, select the event required and either copy or drag the item to the configuration dialog.
-
The Select Rule Item Type dialog is displayed.
In our example we would choose File Path.
-
The rule item is added.
Add application specific User Privilege
You run an Event Viewer query using the Privilege Discovery view and returned results show a high number of Application started elevated event (ID 9062) for a specific Microsoft and you decide to change user privileges accordingly.
-
Open the Application Control console and in the Configuration navigation pane, select Everyone > User Privileges and view the Applications tab.
-
In the Event Viewer dialog, select the event required and either copy or drag the item to the Applications tab of the configuration.
-
The Select Rule Item Type dialog is displayed.
In our example we would choose File Name - or Folder Name to specify a file at a particular location.
-
The rule item is added.
-
Double-click the item. In the Edit dialog click the Metadata tab.
-
Select the checkboxes next to Product Name and Vendor.
Values for these fields are immediately displayed. -
With the Product Name and Vendor fields enabled only an application with matching metadata values will be allowed to run. Any other, similarly named file will be blocked.
Results context menu
Right-click within a column header to display the context menu. The menu lists a number of additional actions.
-
Sort Ascending: Sorts the selected column in ascending order.
-
Sort Descending: Sorts the selected column in descending order.
-
Clear Sorting: Clears the ascending or descending sorting criteria currently set for a column.
-
Group By This Column: Groups the list using the data in the selected column. One expandable list will be created for each possible column value.
If you perform this action on any subsequent columns, that data will be presented as nested groups at increasingly lower levels within the expandable lists.
If Show Group Panel is enabled, this will show the "Group By" boxes in the area immediately above the column headers.
Tip: To turn off the Group By This Column feature and revert to the original view: Enable Show Group Panel. Right-click each Group By box and select Ungroup. Then right-click in the column header and select Hide Group Panel.
-
Show Group Panel / Hide Group Panel: Displays or hides an area immediately above the column headers that contains "Group By" boxes. One "Group By" box will be displayed for each column header for which Group By This Column is currently enabled. You can also drag column headers to and from this area.
The table will be grouped according to the data in the box. If there are two or more boxes then the grouping will be nested, with the left-most box presented at the highest level, the second box presented at the second level, etc.
-
Show Column Chooser: Enables you to add and hide information within the grid. When you select Show Column Chooser, the Column Chooser dialog is displayed. This dialog is used to specify which of the available columns you want displayed within the grid. If you click and drag an entry in the list to a new position in the dialog, the columns in the grid will be reordered to match.
-
Best Fit: Resizes the width of the selected column so that the header text is displayed in the optimal amount of space.
-
Best Fit (all columns): Resizes the width of all columns in the table so that the header text is displayed in the optimal amount of space.
-
Filter Editor: The Filter Editor dialog will show any of the advanced filters that are currently active in the column headers. You can use the editor to modify the existing filter criteria and to build new criteria using the available filter conditions and logical operators.