This page refers to an older version of the product.View the current version of the online Help.
Server-side auditing
The File Director appliance supports sending audit and usage data to a single remote syslog server over a TCP connection. The File Director server requires the IP address and port of a remote syslog server. Only IP addresses are supported as DNS can be unreliable.
The syslog message contains JSON encoded data which can be indexed by software, such as Splunk, to provide reporting and analysis. The facility levels in syslog distinguish between usage and audit log data as follows:
| Element | Details |
|---|---|
| local2 | audit data |
| local3 | usage data |
All messages are sent at the informational severity level.
In this section:
Configure a remote Syslog Server in File Director
- Select Configuration > Advanced and scroll down to the Syslog Server section of the screen.
- Enter the IP address of the remote syslog server and click Update.
Set up a remote Syslog Server
The syslog server must be configured to listen on a TCP port for it to work with File Director. The following steps instruct you how to do this using either Rsyslog or Splunk.
Rsyslog
The standard syslog service included in Ubuntu Server is Rsyslog.
- Create a File Director configuration file in the /etc/rsylog.d folder called 10-dnsyslog.conf.
-
Add the following lines to 10-dnsyslog.conf to listen for TCP traffic on port 10514:
# provides TCP syslog reception$ModLoad imtcp$InputTCPServerRun 10514 - To filter out the File Director messages to separate log files you must create a directory /var/logdatanow and ensure that the syslog daemon has permission to write to that directory.
-
Add the following lines to 10-dnsyslog.conf to redirect the File Director messages and stop them appearing in the normal syslog files:
local2.* /var/log/datanow/audit.log&~local3.* /var/log/datanow/usage.log&~ -
Restart the syslog server to pick up changes using the following command:
service rsyslog restart
Splunk
For instructions on how to set up Splunk to monitor File Director syslog files, see this document.
Troubleshooting
Check for data arriving on the Syslog server
Check for data arriving on the syslog server either in /var/log/syslog or var/log/datanow/usage.log using the following tail command:
tail -f /var/log/datanow/usage.log
Check the server is listening
On the syslog server, use the following command to ensure the server is listening on the port configured:
netstat -nlt | grep 10514
The response should be:
tcp 0 0 0.0.0.0:10514 0.0.0.0:*
 LISTEN
Check the File Director appliance has connected
On the syslog server, use the following command to ensure the File Director appliance has connected:
netstat -nt | grep 10514
The response should be:
cp 0 0 [syslogserver]:10514 [datanow appliance]:42901 ESTABLISHED
If support mode is enabled on the File Director server and you have SSH access, then running netstat on the File Director server should show a similar connection as above.
Report logs
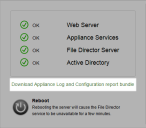
You can download configuration reports and appliance logs which can be used by Ivanti support to check your installation, performance and to troubleshoot your appliance.
Select Home > Status and click the download link.
You may be asked for these reports when contacting Ivanti about File Director.
