Insight powered by AppSense
Insight Web Console
Navigation Menu
The navigation menu includes settings and options to navigate and configure the Insight web console:
- Home Button - Navigate to the Insight dashboard.
- Reports Menu - Access the Insight reports.
- Settings Button - Open the Settings navigation pane.
- Date Range Picker - Select the date range for the data on the Insight Dashboard and reports. If the Auto Refresh setting is enabled, data for the last 7 days is displayed and the Date Range Picker is not available for the dashboard.
- Time Zone Picker - The time zone used to display data in Insight reports.
- User Menu - Log off from the Insight console.
- Help Button - Display the Insight help center.
Dashboard
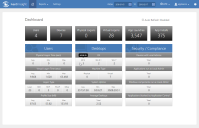
The dashboard page of the Insight web console provides a high-level overview of your estate. It displays a selection of the data that has been collected by your Insight server. This allows you to gain a quick understanding of the endpoints in your estate and how they are performing.
For example, you can immediately see the number of users and devices in your estate that are providing data to your server. You can also see the average logon times for users, allowing you to keep an eye on them without having to look at the specific report every time you need this information.
Where appropriate to the data type, figures can be displayed as a percentage by hovering your cursor over them. In the example below, you can see the percentage of Windows Server 2012 desktops in the estate.
Apply the auto-refresh setting to automatically update data from the server every five minutes. With the setting applied, data for the last 7 days is displayed and the Date Range Picker is not available. If the setting is disabled, data static until the next login or manual refresh and a date range can be selected.
Related topics
Was this article useful?
The topic was:
Inaccurate
Incomplete
Not what I expected
Other
Copyright © 2017, Ivanti. All rights reserved.

