About Visualizations
Use Visualizations to graphically view any type of relationship in CSM.
Examples include:
- Relationships between Configuration Items (CIs) to assess potential risks for an Incident or Change.
- Relationships between personnel (example: Executive, manager, technician).
- Relationships between Service Level Agreements (SLAs), Operational Level Agreements (OLAs), Configuration Items, Underpinning Contracts, and Services.
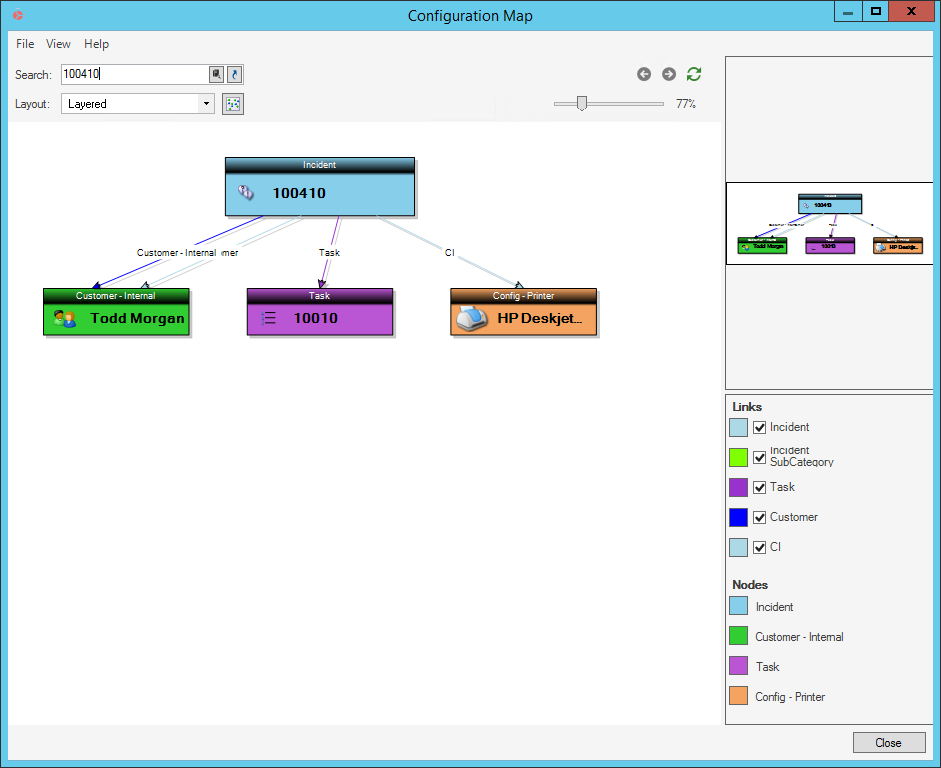
The following example Visualization is a Configuration Map that shows relational data for an Incident:
Some possible uses of Visualizations include:
- Configuration map.
- Organizational chart.
- Change sources (Incidents and Problems that feed a Change).
A Visualization always starts from a single primary object and shows other objects related to that object (and objects related to those objects, and so forth). The lines (links) between objects represent relationships (possibly multiple Relationships) and the color of the links indicates a set or chain of associated relationships.
There are a number of different ways that Visualizations can be laid out to show data appropriately. Also, if an object is in an alert state (example: If a server is down), the object node can be configured to appear in a different color.
Each user has a designated default Visualization, which displays when the user presses Shift+F7 in the Desktop Client. The default Config Visualization is initially selected in CSM Administrator, Globally or by Role. Access available Visualizations using the Visualization Manager.
Visualizations can be exported into PDF, SVG, or Viso (.vsdx) files.
CSM provides several OOTB Visualizations to help visualize common business flows. Use these Visualizations as-is, edit them, or create your own using the Visualization Manager.