Gauge Widgets
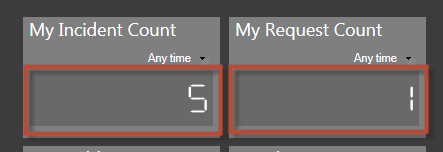
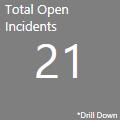
A Gauge Widget displays a single data point, possibly with some range data. Use a Gauge Widget to display the:
- Number of Incidents Opened/Closed today (Text).
- Number of Incidents assigned to me (Text).
- Number of Open Priority 1 Incidents (Thermometer).
- Customer Experience rating (Speedometer).
The following figure shows an example of Gauge Widgets on a Dashboard.

CSM provides several types of gauges:
| Gauge Type | Example |
|---|---|
| Horizontal Linear |

|
| Numeric (Digital or Mechanical) |


|
| Speedometer (Angle, Rectangular, Round, Round Rectangular) |
|
| Text |

|
| Thermometer Linear |

|
| Vertical Linear |

|
Good to know:
- A Gauge Widget is highly configurable; define general properties (example: Gauge type, title, Business Object association, refresh rate, and filter exclusion), data to include, values to display, scale options, threshold options, text and number formats, drill-down behaviors, and display properties.
-
A preview of the Widget (with randomly generated data) is available at the top of the window. Use this to preview your Widget as you build it.
-
Refresh executes only when a Widget is active and being displayed. If you leave a dashboard and come back to it, the data will be automatically refreshed and the refresh timer will start over.
- Use refresh on Widgets where the data is likely to change (example: A Widget displaying Incident data).
- A Dashboard's Refresh properties determine whether or not to 1) use the Dashboard's scheduled refresh instead, and/or 2) allow its Widgets to refresh themselves in addition to the Dashboard's scheduled refresh. For more information, refer to Dashboard Refresh in the Dashboards documentation.
- By default, gauge colors (banner, labels, face, grid line/tick, and threshold) and style (flat, chrome, or none) come from the defined Dashboard Theme; however you can override some of the properties.


