Define Slices for a Pipeline Chart Widget
Use the Slices page (accessed from within the Chart Series window) to define the values to display in the Pipeline Chart Widget. Each value will be a slice.
Properties include:
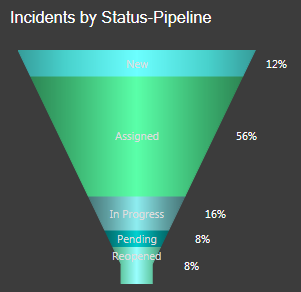
- Slice: Field whose values will be displayed as slice in the pipeline (example: Status field—values might be New, Assigned, In Progress, etc.).
- Display:
- What labels to display on the slices (name, percent, value).
- Where to put the labels (On slices or on side). In the Browser Client, labels can only be placed on slices.
- How to format the labels (Dash before side labels, color side labels, space between slices, and number of decimals spaces to display in the values. This will be used for both values and percentages.
The Chart Series window is accessed from within the Widget Manager when you create or edit a chart widget, and then add a series.
To define slices for a pipeline chart widget:
- Create a chart widget.
- In the Chart Series window, select the Slices page.
- Select the values to display as slices:
- Field Name: Select the field whose values will be displayed as slices in the pipeline (example: Status field—values might be New, Assigned, In Progress, etc.).
If the field you select is validated, the information automatically populates the List of Slices information.
- Use Foreign Key: You can enable the use of a foreign key on the drill-down of the value. When you drill down into a single value in a chart widget, it displays a record list. Enabling the use of foreign key lookup ensures the use of the validation ID property, so results return matching records created in all cultures. The check box is only visible and applicable to fields that are configured for globalization and validated against a localized lookup table.
- List of Slices: Select the Business Object/field that supplies the values to the above field (Typically, this is a Lookup Object/field):
- Business Object: Select the Lookup Object that supplies all the possible values for the above field (example: Incident Status).
- Value Field: Select the Lookup field (Field in the above Lookup Object) that supplies the values (example: Status).
- Order By: Select the field to use to order the values in the pipelines, as well as an ascending (example: 0-10, A-Z) or descending (10-0, Z-A) order.
Rarely will the alphabetical order match the order in which the values should appear in the pipeline, unless you prefix the values with numbers or letters (example: For status, you would likely want lifecycle order, not alphabetical order); therefore, it is common to define a field that contains a sequence number purely for controlling the order (example: Status Order).
- Show all values, even if no data: Select this check box to display a slice even if there is no data for it (example: There are no Incidents). The default behavior is to not display a slice if there are no values for it.
- Field Name: Select the field whose values will be displayed as slices in the pipeline (example: Status field—values might be New, Assigned, In Progress, etc.).
- Define display options for the slices and values:
- Labels on slices: Select this check box to display the values as labels inside each slice. You can display the name, percentage, and/or actual value.
- Labels on side: Select this check box to display the values as labels on the right side of each slice. You can display the name, percentage, and/or actual value.
- Dash before side labels: Select this check box to include an em dash before the side values.
- Color side labels: Select this check box to make the side value text the same color as the slice it represents.
- Space between slices: Select this check box to add a small space between the slices.
- Decimals: Specify the number of decimals spaces to display in the values. This is used for both values and percentages.
-
Select OK.