Working with Dashboards
•About Flex Charts vs. HTML5 Charts
•Adding or Removing Columns or Rows to a Dashboard
•Assigning a Dashboard to a Role
•Default Dashboards
About Dashboards
The administrator defines the default dashboard for your assigned role.
You can create dashboards if your role has create permissions for dashboards. (See Assigning Business Object Permissions to determine your permissions.)
If your role has edit permissions, you can publish the dashboards that you create to other roles and you can set a dashboard as the default for a role.
You can define as many dashboards as you want. However, only the default dashboard appears automatically in the workspace. You can only have one default dashboard at any time. If you select another dashboard to be the default for a role, then the previous default dashboard is no longer the default.
When you first log in to Service Manager, the application automatically shows you your personal default dashboard. If that dashboard is not available, the application shows you the default dashboard for your role.
Once in the workspace, you can choose a different dashboard to view.
See also Supporting a URL in a Dashboard.
How Dashboards Refresh
Starting in Service Manager Release 2016.2, the behavior for how you access and refresh dashboards and workspaces has changed. We made these changes to improve performance related to the speed of opening workspaces. There are two changes in behavior:
•Making changes to a workspace while it is open: Before Release 2016.2, if you had a top-level tab (workspace) open and made changes in the Configuration Console that affected that workspace, the application automatically displayed the changes. Starting in Release 2016.2, if you open a top-level tab (workspace) and make changes in the Configuration Console that affect that workspace, you must refresh the workspace to see the changes.
•Making changes to a workspace while it is not open: Before Release 2016.2, if you had a top-level tab (workspace) open and closed it, the application deleted that instance of the workspace. If you re-opened the top-level tab (workspace), the application opened a new instance of the workspace and automatically displayed any changes that you made in the Configuration Console while the workspace was closed. Starting in Release 2016.2, if you close the top-level tab (workspace), the application no longer deletes that instance of the workspace, but instead hides it. If you re-open the top-level tab (workspace), the application does not display the changes that you made in the Configuration Console unless you refresh the workspace.
About Dashboard Charts
Depending on your role, your dashboard can contain charts that give you a graphical view of the data. See Using Chart Parts and the Chart Wizard for more information on each type of chart.
Sample Service Desk Manager Dashboard
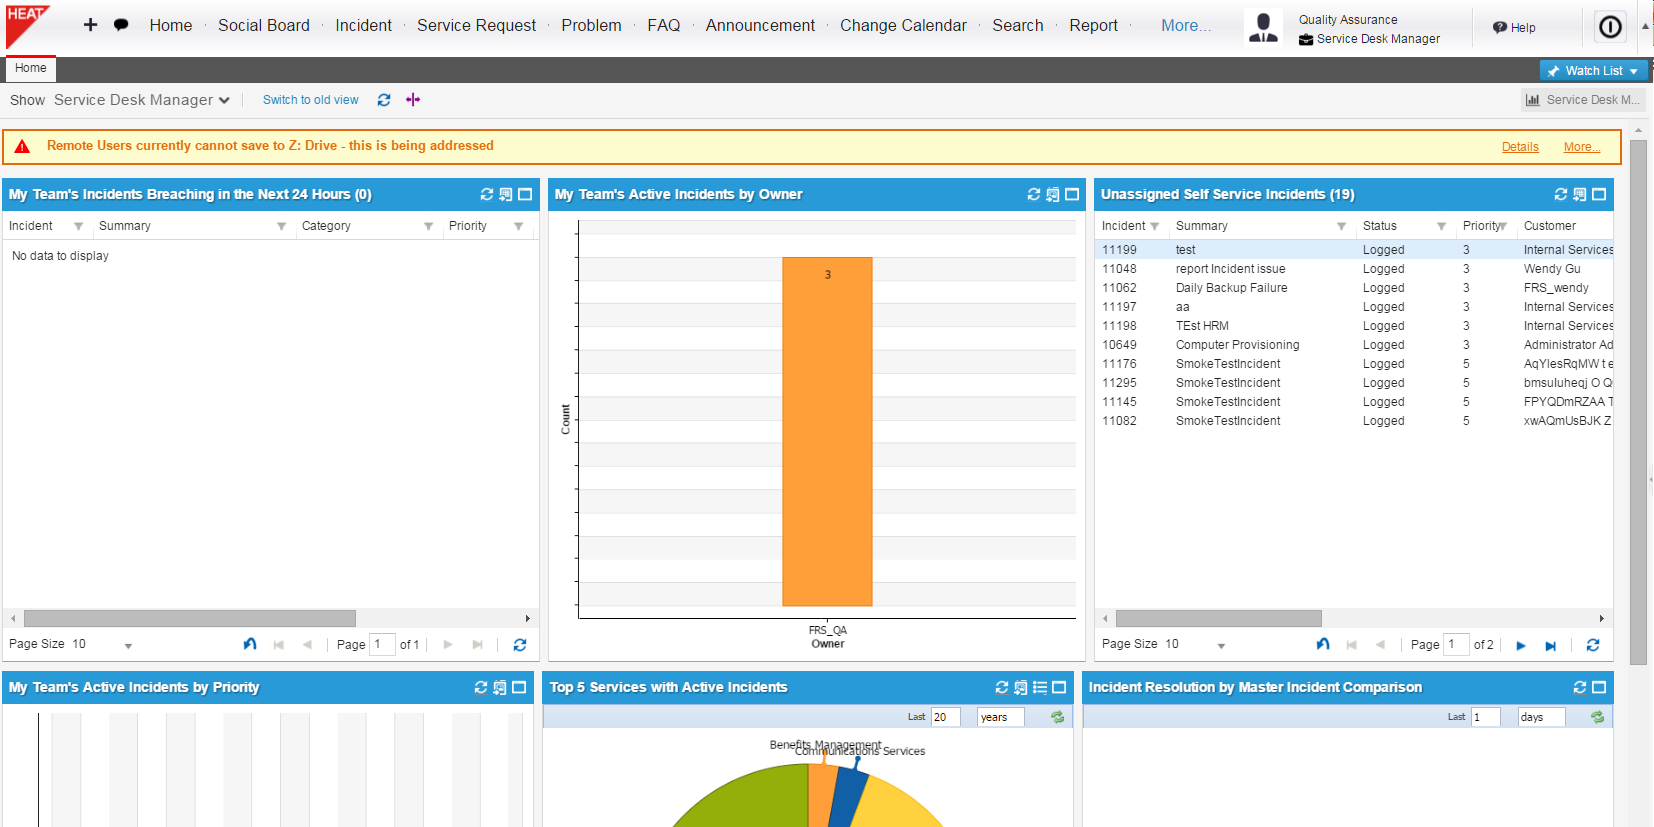
Charts interact with the data in unique ways:
•Hover over a chart element (such as a bar or pie slice) to see the data being measured.
•Click a chart element to drill down the data.
•Click the toggle legend icon  to show or hide the chart legend. The legend state persists when you refresh the chart.
•Click the legend to deselect the series.
•Click the maximize icon  to zoom in to full window size.
•Click the close icon  to zoom out to dashboard size.
•Click the export to image  to save a .png image of the chart to your downloads folder.
•Double-click an item in the chart to view a list of those items.
HTML charts do not render correctly if the dataset contains many items. For example, the Summary field of the Incident business object is a text field that contains unique data for each record. If you attempt to group by this field, every record appears in the bar item and does not render in HTML.
About Flex Charts vs. HTML5 Charts
Service Manager now has HTML5 charts for dashboards, although the traditional flex charts will continue to be available for a limited time. HTML5 charts enable tablet and mobile users to view the dashboards accurately. In addition, HTML5 charts can handle more data points for better performance.
At the top left corner of the dashboard, next to the dashboard name, click one of the following:
•Try our new look! to see HTML5 charts.
•Switch to old view to see flex charts.
Grouping by multiple items can return a large number of data points. In these cases, HTML5 rendering is slower than flex rendering.
You can export an HTML5 chart as .png image. On the chart to export, do the following:
1.Click the maximize initial view icon  .
.
2.Click the export to image icon .
3.In the dialog box, click Save > Save as and name the image file as appropriate.
Note that the legend is not exported with the HTML5 chart.
Creating a Dashboard
1.From the Configuration Console, click Build > Charts and Graphs > Dashboards to open the Dashboards workspace. The application displays a list of dashboards.
2.From the toolbar, click New Dashboard. The application displays the Dashboard Center.
3.From the Dashboard Center accordion columns on the left, click Dashboard Information. The application expands the dashboard information area.
4.Enter information into the fields.
| Field | Description |
|---|---|
| Layout | Specifies the layout orientation. Select Column or Row. |
| Fit vertical size | Automatically fits the window to the vertical (top to bottom) size of the user's screen. |
| Min horizontal size | The minimum horizontal size, in pixels, of the window. |
| Min vertical size | The minimum vertical size, in pixels, of the window. |
| Name | A unique name for the dashboard part. Duplicate dashboard names can produce unexpected results. |
| Description | A description of this dashboard part. |
| Category | The data category. Select from the drop-down list. |
| Auto refresh (in minutes) |
The number of minutes in which the data automatically updates. Choose from the drop-down list.
NOTE: On-premise customers can disable this setting by doing the following: 1.Open the \AppServer\Web.config file with a text editor. 2.Go to <add key="IsAutoRefreshDisabled" value="false"/>. 3.Change the value from false to true. 4.Save the file. |
| Add to my dashboards | Makes the dashboard available to your role for selection. |
| Set as Default to MySelf | Sets the dashboard part as the default on your Home tab when you log into your role. |
| Refresh on Dashboard Select | Refreshes the data each time that the dashboard is loaded. |
| Publish to |
The roles that this dashboard part is available for. The menu options depend upon your role. You might see only one available role selection if you are in one role, or several role selections if you belong to several roles. See Assigning a Dashboard to a Role. |
| Default for | The roles that this dashboard is the default for. The default dashboard automatically appears on the home page for this role. Each role can only have one default dashboard. |
| Alerts | Shows the alerts banner on the dashboard. See About Alerts. |
| Search |
Shows the search area in the dashboard. See Using Search. You can only search for a business object if it is available to your role. The top-level Search tab for your role must have the business object name defined for you to be able to search for that business object. By default, the Search tab is configured to search for FAQs and announcements. |
5.Add dashboard parts to the workspace area. You can drag and drop dashboard parts from the accordion columns or you can create your own dashboard parts. See Using the Dashboard Center.
6.Click Save.
Modifying a Dashboard
Only administrators can edit dashboards and parts that you create. If your role has edit permissions for dashboards, you can edit dashboard parts created by other users.
1.From the Configuration Console, click Build > Charts and Graphs > Dashboards to open the Dashboards workspace. The application displays a list of dashboards.
2.Click the edit icon  next to the dashboard to edit. The application displays the Dashboard Center.
3.From the Dashboard Center accordion columns on the left, make changes to your dashboard, including layout, category, alerts, and search. Select the charts, tables, special parts, tree parts, or pivot tables tabs to make changes to these specific parts.
4.Drag and drop parts from the left columns onto the main workspace to add them to the dashboard. To rearrange dashboard parts, click the header of the part, then drag and drop.
5.Click Save.
Adding or Removing Columns or Rows to a Dashboard
1.From the Configuration Console, click Build > Charts and Graphs > Dashboards to open the Dashboards workspace. The application displays a list of dashboards.
2.Click the edit icon next to the dashboard to edit. The application displays the Dashboard Center.
3.To add a column to the dashboard, do the following:
| a. | Under the Dashboard Information heading, ensure that the Layout field is set to Column. |
| b. | Click the add column  icon. The application adds a new column to the right of any existing columns. The dashboard can have a maximum of 5 columns. icon. The application adds a new column to the right of any existing columns. The dashboard can have a maximum of 5 columns. |
4.To add a row to the dashboard, do the following:
| a. | Under the Dashboard Information heading, ensure that the Layout field is set to Row. |
| b. | Click the add row icon. The application displays a new row at the bottom of the dashboard. |
If you change the layout from column to row or from row to column, you must resize the dashboard parts that are displayed to fit within your layout.
5.Click Save.
Resizing a Dashboard Part
The size of the dashboard parts are defined globally. However, if you resize the parts, you override the default size.
1.From the Configuration Console, click Build > Charts and Graphs > Dashboards to open the Dashboards workspace. The application displays a list of dashboards.
2.Click the edit icon next to the dashboard to edit. The application displays the Dashboard Center.
3.From the Dashboard Center, click Resize. The application displays colored lines at the outer edges of each dashboard part on the right side.
4.Hover your mouse over the lines until you see the resize handles, then click and grab the handles to resize the parts.
5.Click Save.
Deleting a Dashboard
You can delete a dashboard that you have created.
Unless you are an administrator, you can only delete dashboards and dashboard parts that you created. If your role has delete permissions for dashboards, you can delete dashboard parts created by other users.
1.From the Configuration Console, click Build > Charts and Graphs > Dashboards to open the Dashboards workspace. The application displays a list of dashboards.
2.From the right column, click the delete icon  corresponding to the dashboard to delete. The application displays a Delete Dashboard confirmation window.
3.Click Yes.
The application removes the dashboard from the list.
Assigning a Dashboard to a Role
Users can create dashboards for themselves, and administrators can create dashboards for any user. Users who have certain permissions can also publish dashboards to specific roles.
When a role has multiple dashboards, the application automatically displays the default dashboard on the home page. Each role can have only one default dashboard. The remaining dashboards are listed under All Dashboards.
1.From the Configuration Console, click Build > Charts and Graphs > Dashboards to open the Dashboards workspace. The application displays a list of dashboards.
2.Click the edit icon next to the dashboard to edit. The application displays the Dashboard Center.
3.From the Dashboard Center accordion columns, select Dashboard Information. The application displays general information about the dashboard.
4.In the Publish to field, select the roles to publish this dashboard to. If you cannot select any roles, you do not have permission to publish the dashboard.
5.Click Save.