About Alerts
An alert is a notice that appears at the top of a dashboard. By default, alerts appear in three categories:
•Red: System or application error, such as a performance issue or application shut down.
•Yellow: Warning message, such as users unable to perform certain tasks.
•Blue: Informational message, such as informing users of a printer that has been moved.
Creating an Alert
1.Log in to Service Manager.
2.Open the Alert workspace. A list of current alerts appears.
3.From the toolbar, click New Alert. A blank alert form appears.
Blank Alert Form
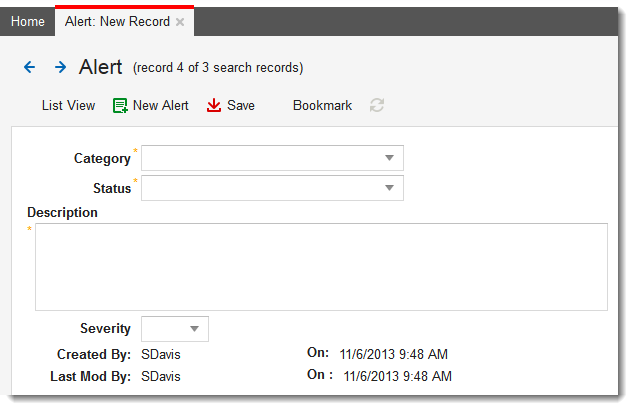
4.Enter information into the fields.
•Category, Status, Description, and Severity.
5.Click Save.
To see the new alert, go to the dashboard containing the alert bar and refresh your browser window. The alert also appears as a message on the Social Board workspace..
Modifying an Alert
1.Log in to the Service Manager.
2.Open the Alert workspace. A list of alerts appear.
3.Double-click the alert to modify.
4.Make necessary changes to the alert.
5.Click Save.
Deleting an Alert
1.Log in to the Service Manager.
2.Open the Alert workspace. A list of current alerts appears.
3.Select the alert to delete.
4.Click the Delete icon  from the toolbar.
The alert is no longer listed.
Adding an Alert Bar to Your Home Page or Default Dashboard
You can add an alert to your Home page or default dashboard through the Dashboard Center.
Your administrator defines which roles can create, edit, or delete alerts and dashboards.
1.Log in to the Service Manager.
2.Click the current Dashboard bar and then click All Dashboards. The application displays a list of all available dashboards.
3.Click the Edit icon  next to the dashboard to which to add the alert bar. (To add it to your Home page, select your default dashboard). The system displays the Dashboard Center.
4.Under Dashboard Objects, click Dashboard Information. The Dashboard Information area expands.
5.Select the Alerts check box at the bottom of the section in the Addins sub-section. This adds an alert bar to the dashboard.
6.Click Save.