Portfolio Landing Page
Role: To roles that have been assigned by your Administrator.
Minimum Version: Ivanti Neurons for ITSM 2024.4.
Feature Eligibility: Available to customers who have purchased both Ivanti Neurons and Neurons for ITSM and have converged tenants and tenants that have One Ivanti Login enabled. For details, reach out to the Ivanti Operations team.
Feature Availability: New and existing ITSM cloud deployments only, not available for on-premises customers.
The Portfolio Landing Page presents collated data from Neurons Platform and ITSM in the form of widgets, providing business insights for executives and managers to understand company performance and key areas for improvement.
Accessing the Portfolio Landing Page
1.Log in to Neurons or ITSM.
2.Click the Portfolio Landing Page icon ![]() on the left panel.
on the left panel.
When you log in to Neurons or Neurons for ITSM - Administrator and User Help, the Portfolio Landing Page is the landing page until you switch the app from ITSM to Neurons or vice versa using the app switcher. Once you have switched the app, upon subsequent log in, the Home page is the landing page.
The Portfolio Landing Page view that is displayed depends on whether you are logged in with the role of Executive or Manager. You can be assigned either one role, or both roles, by your Administrator in the settings for Neurons Platform Access Control.
Manager view
Items appearing in pink or green are actionable insights, which can provide key indications as to how the company is doing. Pink is a negative value and green is a positive value.
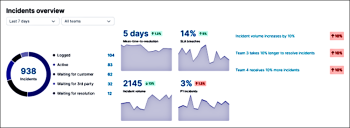
Incidents overview
Displays the number of incidents logged over time, and a breakdown by status. Highlights in the center show trends in Mean Time To Resolution (MTTR), SLA breaches (to identify patterns and seasonality), incident volume, and number of P1 incidents.
Actionable insights display changes in incident volume, which team takes longest to resolve incidents, and which team receives the most incidents.
Submitted vs resolved incidents
Displays the number of submitted incidents vs resolved incidents over time, and per team.
SLA Breaches
Displays the number of incidents that breached their service level agreement (SLA), over time, and per team. You can view the type of incident SLA was breached the most and which is the top breached service level agreement.
Team Performance
Using this data, you can monitor individual team performance for fixing incidents and how many of these incidents breached their SLA. The widget displays which services caused the most incidents to be raised by customers.
Device Insights
Displays the devices classified by Operating System (OS). Device warranty expiration enables you to identify warranties that are expiring the soon. Devices discovered by type reveals the breakdown of devices by category across the organization.
Executive view
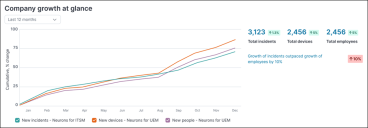
The Cumulative % Change in the Y axis measures the relative change in a value over time compared to a baseline value, expressed as a percentage. In this case, the baseline value is determined using a filter, for example, the last 90 days. Each data point represents the changes from the baseline to that point, rather than just the change between consecutive time intervals. This approach helps track overall trends consistently over time.
Items appearing in pink or green are actionable insights, which can provide key indications as to how the company is doing. Pink is a negative value and green is a positive value.
Company growth at a glance
Displays data for new ITSM incidents, new Neurons platform devices and new Neurons Platform people. The Neurons device and people data is either imported by connectors or collected by Ivanti Neurons Agents.
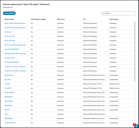
The actionable insight enables you to instantly see if the growth of incidents is outpacing the growth of employees. You can also drill down in to the lists of incidents, devices, and employee data.
Incident overview
Charts show trends in Mean Time To Resolution (MTTR), SLA breaches, incident volume, and number of P1 incidents. Actionable insights reveal trends in incident numbers and SLA breaches using data from any of the four charts in this tile.
Assets
Displays asset or device information. Devices by type reveals the breakdown of devices by category across the organization. Device warranty expiration enables you to identify warranties that are expiring the soonest. Devices are also categorized by manufacturer.
Risks
Risks to the organization are displayed in a chart detailing how many devices have been exploited and by which method; your patch policy, and the status of devices that are missing patches, have vulnerabilities, or have had missing patches exploited.
The incident data comes from ITSM and device data comes from the Neurons Platform.The frequency of Neurons devices and people data sync for the changes to reflect in the widgets depend on the configuration. The frequency of ITSM data sync is every 15 minutes.
Switching views
If you have both Executive and Manager roles, select the dropdown list to change the view.
Filtering and sorting information
Use the dropdown lists to filter the data shown in the charts, based on different criteria. For example, date range, service, priority. Changing a filter affects the data in one whole tile, which can include several chart widgets.
Accessing detailed information
Click on items shown in blue to access further detail and perform root cause analysis.
Both executives and managers can access this first level of detail.
Managers can then drill down in to further levels of information, for example, into Incident records.


