Viewing Statistics
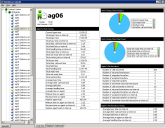
Use the Statistics Console to view statistics for an agent, agent group, or service by selecting the agent, agent group, or service in the hierarchy on the left. The statistics pertaining to the object you select appear on the right. For example, to view the statistics for an individual agent, expand the hierarchy until the name of the agent appears, then select the agent’s name. Select All Agents to view a compilation of the statistics for all agents. Select Contact Center to view a compilation of the statistics for the entire contact center. Select a service to view the statistics pertaining to that service.
One Statistics Console can monitor multiple Ivanti Voice deployments. Use the tabs at the bottom of the hierarchy on the left to choose the Ivanti Voice deployment you want to monitor.
The tabs at the bottom of the right pane of the Statistics Console let you view different types of statistics as well as statistics from different time periods. The tabs change depending on the object you select in the hierarchy on the left. The possible tabs are:
•Last hour - Displays statistics Ivanti Voice calculates using data recorded between 60 minutes ago and the present.
•Outbound - Displays outbound call statistics (refer to Outbound Statistics).
•Overview - Displays a combination of statistics Ivanti Voice calculates using data recorded since midnight, and data recorded between 60 minutes ago and the present.
•Staging - Displays statistics based on queue stages (refer to Queues).
•Today - Displays statistics Ivanti Voice calculates using data recorded since midnight, or another time you specify in the configuration (refer to Statistics and Metrics Engine (SME) Scheduled Updates).
•Services - Displays services statistics Ivanti Voice calculates using data recorded since midnight, and data recorded between 60 minutes ago and the present.
•Inbound - Displays inbound call statistics.
