Analyzing a poorly performing system
Diese Informationen sind nur in englischer Sprache verfügbar.
This section provides hints and tips to help you analyze and resolve a poorly performing Service Desk system.
The most important piece of advice is to ensure that the environment where Service Desk is being installed fulfills the requirements specified in Unterstützte Plattformen and the Technical Specification & Architecture Guidelines.
General analysis steps
Observe the reported performance issue yourself, don’t accept someone else’s description: you might see something different.
Identify the architecture and what’s running and where it’s running: draw a diagram. Ensure that all of the servers have sufficient free disk space.
You need to get an understanding of areas where you believe performance needs to be increased and where it is already working well. For example:
- Is the system slow with a single user or does it just slow down with multi-user access? If it’s slow with one user then the issue is probably some sort of configuration/environment issue.
- Is the system slow when logging in / loading windows / loading certain windows / running queries / running certain queries?
- Is the system slow when using Console or Web Access or both?
- Does the system run faster when on a client computer or on the server itself?
- Does the system run well for periods in the day or when no active users are in the system but slow periodically or in periods of high usage?
Use performance monitor to monitor the server specifically for the Service Desk Framework (for both Console and Web Access) and for Web Access.
Monitor the W3WP, W3WP#1... processes for CPU activity and private bytes. Is the average CPU of the processes high (70%)? Are private bytes increasing without coming back down (no saw tooth graph?). If the Service Desk Framework and Web Desk are running in different application pools, there will be a different W3WP process for each. The name of each W3WP process will depend upon which started up first. For example, if the first connection was to Web Desk then W3WP will be Web Desk and W3WP#1 will be the Service Desk Framework. If the first connection is Service Desk then W3WP will be the Service Desk Framework. This will get more confusing if other applications (and application pools) are running.
Use Windows Task Manager to identify if other applications are running that are taking up resources (CPU or memory for example).
Error logging – are there errors in the event log? Turn on Service Desk Framework logging to record errors. Not only will this give more detail but it will also indicate which users are generating errors, which may be useful in tracking down the problem. Sometimes a slow performing system comes down to errors.
Check the timings of specific operations (for example, displaying windows, running a query, saving an incident) and compare these results with the expected results.
Is performance a general issue or in a specific area?
Set up a test system.
Run Console and Web Desk on the server that is running the Service Desk Framework and Web Desk – is this different from the end-users' experience? If so, this may mean it’s a network or desktop issue.
Service Desk Design Issues
Are there certain specific designs that have been implemented that are causing specific performance issues? For example:
- Queries that produce inefficient or slow SQL – this can be analyzed with profiling tools or recording specific queries using the Service Desk Framework logging features and passing these queries through optimizers and profiling tools.
Service Desk bugs
Some performance issues may be down specifically to bugs. This will normally relate to handling large amounts of data inefficiently. For example a bug found (and fixed and patched for 7.2.3) revolved around adding end users to groups and roles in the administration module where there were already a large number of users in that particular group or role. These types of issues are usually reasonably easy to track down as long as a good description / analysis is provided by the user.
Database
The main things to look for are database timeout errors occurring in the Service Desk Framework error log and a large number of deadlock errors as well (deadlock errors will always occur, but may be more frequent in a poorly performing system). If these are happening it usually means that some indexes on some tables have become fragmented. Fragmentation occurs when large numbers of records are added to tables. This can happen gradually over time (for example, over a year as the number of incidents increases) or quickly if a large import is done. The solution is to re-build the indexes on all tables. We recommend that this is done periodically (for example monthly) or after a large import. In SQL Server you can set up a database maintenance plan to perform this regularly.
There may be specific SQL queries that are taking a long time irrelevant of any fragmentation. You can analyze these as described previously using profiling tools and Service Desk Framework diagnostic logging.
See Diagnoseprotokollierung for details of how to use diagnostic logging for SQL tracing.
The database server may be being shared with other databases that may be affecting the performance of Service Desk. This should be identified and if possible the Service Desk database moved to a dedicated server.
Check the database for bespoke work such as triggers and stored procedures.
Service Desk
Ensure that communication is not going via a proxy server (LAN or WAN). You can check this using Internet Explorer’s LAN Settings from the Connections tab under Tools\Options. If messages are going via a proxy, then they may be going further distances and through a poorly performing proxy server. This will slow down the communication (high latency) so reducing performance. Exceptions can be set up so that the proxy server is by-passed.
When you connect to a Web server using the Internet Protocol (IP) address or Fully Qualified Domain Name (FQDN) on the local network, the connection is through an assigned proxy server even if the Bypass proxy server for local addresses option is enabled.
However, if you connect to a Web server using the host name (for example, https://webserver) instead of the IP address (for example, https://10.0.0.1) or FQDN (for example, https://webserver.domainname.com), the proxy server is bypassed and Internet Explorer connects directly to the server.
For information about bypassing a proxy server, see the external Microsoft docs.
You can add proxy exclusions directly to console. For more information, see the following Community article.
Use local file caching – for LAN or WAN access. This caches meta data locally in files, so once created subsequent start-up of the application and initial actions should be improved (7.2.4 and above only).
If performance is poor under load, then it is likely to be due to the load being placed on the instance of the Service Desk Framework that all Consoles are connecting to. Check this using performance monitor. If this is the case, then the instance of the Framework will have high CPU utilization. In this case scale out of the Service Desk Framework Web server is required or add additional CPUs to the server. If scale out is chosen so running multiple servers, load balancing can be implemented over the multiple instances of the Framework or Service Desk applications can be ‘hard wired’ to specific Framework instances. If the number of concurrent Service Desk users is around 100 for each Framework instance this may likely be the cause of the performance problem.
Knowledge searching
In certain circumstances, knowledge searching can be triggered more frequently than has apparently been configured. If the performance of a specific window (typically the Incident window) is still an issue, check that there are no Knowledge Handlers on the window.
To check for the presence of Knowledge Handlers on a window:
- Make sure that the keys <add key="ShowHandlerConfiguration" value="true" /> and <add key="ConfigureHandlers" value="true" /> are added to the console.exe.config for the client that you are using, then start Service Desk.
- Start the Window Manager component, and open the required window.
- Click
 to display the Properties grid, then click a control on the window.
 - In the Properties grid, under Configurable Properties, click the browse button alongside Handlers.
The Handlers dialog appears.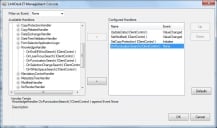

- Make sure that none of the KnowledgeHandler handlers are configured for the control.
- Repeat this for each control on the window, then save the changes.
Other applications
Other applications running on the same computers may have an effect on the performance of Service Desk applications. For example, Virus Scanning software has been known to cause problems. Virus scanning software is not a problem in general, but issues have been seen where versions of software were incompatible with the hardware they were running on. This had the effect of a very poorly performing web application with a single user. On analysis, the CPU profile in this case was very different from what was expected. Rather than seeing a spike of CPU per user operation, the CPU usage was more of a ‘tower’ shape, ie more CPU processing was being used to perform the same operation. In this case this was shown up in the processing of the web application itself not the virus scanning software presumable due to the nature in which the virus scanning software ‘attaches’ itself to applications.
In most cases virus scanning software is compatible with Service Desk applications, this was a special case. However, due to the nature of virus scanning, performance of the application will degrade (hopefully only slightly) with virus scanning in use. One way to eliminate this from the problem is to turn virus scanning off temporarily to see if it has any significant effect on the overall performance. If so, then there is a problem.
Interaction with other applications can be the hardest issues to analyze.
Hardware issues
Just because the system is not on the recommended minimum specification does not mean this is the cause of the performance problem. Normal analysis such as running performance tools to monitor CPU and memory will indicate if this is actually the problem.
Specifically check for:
- Memory utilization
- CPU utilization – Dual or quad will give better performance under load
- Network Card – Has it been configured to 10Mbits/s rather than 100Mbits/s
- Network Routers – Are they configured to prioritize between different types of traffic i.e. HTTPS
- Network speed – connection from client to server, network hops, network traffic