Reported patches (2019 SU2)
Endpoint Manager and Security 2019.1 SU2 adds a new "reported patches" view in Patch and Compliance > Reported patches. This feature analyzes and summarizes how successful your Windows patch deployments have been.
For example, if you have a set of Microsoft Patch Tuesday patches, you could use this feature with your pilot group to decide whether the patches are good candidates for broad deployment in your environment.
Reported patches relies on data from the user feedback agent, which isn't installed on endpoints by default. You'll see a red warning bar in the Reported patches view if you haven't created an agent configuration that allows user feedback data collection.
- Click Tools > Security and Compliance > Agent settings.
- In the Agent settings tree, click Distribution and Patch. Double-click an existing agent setting or create a new one.
- On the left, click User Feedback.
- Select Allow the user to report broken applications, and then select Collect data on good patches.
- Applied patches are considered good if the user feedback agent doesn't detect any application crashes or freezes after installation. The default Timeout for good patches is 30 hours. Change this if a different timeout works better in your environment.
- If you want to hide the user feedback interface and system tray icon on devices, select Hide the user interface. Background data collection will still happen if the user interface is hidden.
- Click Save.
- Deploy the updated agent configuration.
Once you've enabled data collection and deployed the user feedback agent, the deployed agents need a few weeks to run in the background and gather data from endpoints. Users need to run applications, and over time the agent uses that data to understand what applications a patch might affect. Data collection also includes direct user feedback if the user feedback interface is enabled on devices. For more information, see Patch user feedback.
Reported patches workflow
After you've enabled endpoint user feedback data collection as described above, follow these steps to use the Reported patches view:
- Define what you want to patch and add it to a filter definition group, as described in Patch filter definitions.
- Deploy the patch to your pilot group.
- Go to the Reported patches view to evaluate results. The report won't show complete results until the good patch timeout interval has passed. Patch incidents that cause crashes or freezes will be reported soon after they happen.
- If the results are good, deploy the patches more broadly.
Using the Reported patches view to evaluate results
In Patch and Compliance, click Reported patches. This view shows you reported patch data, such as how many patches were installed and whether the patches broke applications or were reported as bad through user feedback.
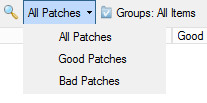
Use the toolbar's Patches filter to show data for All Patches, Good Patches, or Bad Patches.
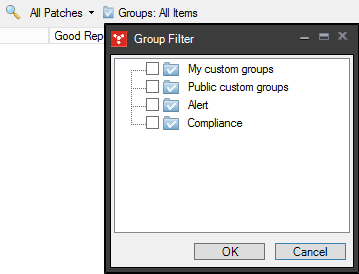
Use the toolbar's Groups filter to limit the report to the selected patch groups. For example, if you have a patch campaign that is based on a custom patch group, you can select that patch group in the Groups filter and easily see just that campaign's status.
The Reported patches table columns help you interpret the collected data. The Bad Reports and Good Reports columns show you the number of reports for each type. The Bad Ratio and Good Ratio columns show you the percentages of deployed patches that were considered Bad or Good.