Running reports
Use the Reports tool to run reports, organize them, and create new ones. You can schedule reports to run one time or on a recurring basis. You can also import and export reports for use on other Endpoint Manager consoles.
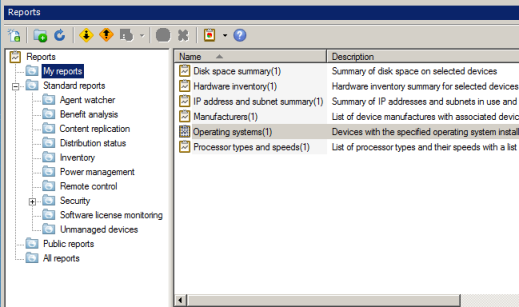
The quickest way to view report data is to run the report from a console. The report viewer displays the data as a preview of the printed page or as continuous data. You can change views and formats in the viewer. You can also change report parameters to select a subset of the data.
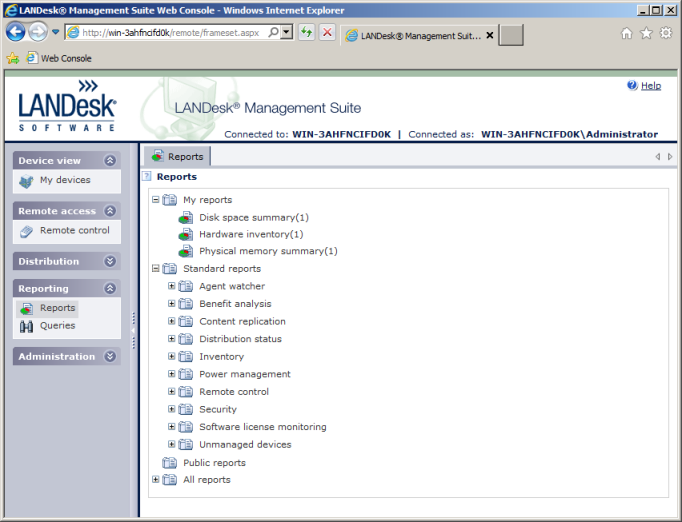
Reports in the Web console
When you use the Web console, the reports found in the Windows console are available to you, but there are minor differences in the way you view and select parameters. You can't edit or create a custom report in the Web console, or move reports between folders, but you can execute, view, and export reports.
Changing report properties
You can make a copy of a predefined report and modify items in the Report properties dialog box. You can change the type of chart displayed in the report and specify a different query field as the key element in the query. You can also select an LDMS query to use as the basis of the report. You can change the name and description as well.
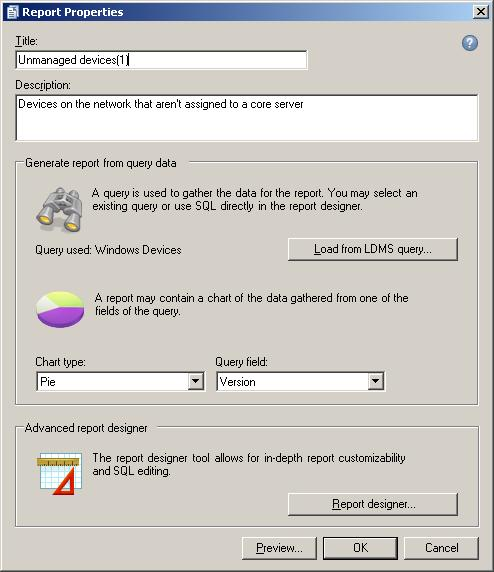
If you want to make more extensive changes to the report, you'll need to open the report designer. See
Creating custom reports for details on using the report designer.
Report viewer
When you run a report, the report viewer launches and displays the generated report. This report viewer provides controls that let you display the report according to your viewing preferences. You can also export a report from the report viewer or save it in a different format for distribution.
The report viewer includes a toolbar and a sidebar. The toolbar consist of the following buttons:

- Open: Open a saved report in the viewer.
- Export: Save the report as an image (in BMP, EMF, GIF, JPEG, TIFF, or PNG format), or in HTML, PDF, XML, XLS, or DOC format.
- Copy: Copy the contents of the report for the selected page.
- Print preview: Toggle print preview (page view) mode. When this is not selected, the report displays as a single HTML page.
- Page setup: Change page, layout, and watermark settings.
- Print: Opens your standard default printer dialog box.
- Sidebar pane: Toggle the sidebar pane, which displays search and parameter options and thumbnail view.
- Back to parent report: If you are viewing a sub-report, return to the parent report that launched the sub-report.
- None: Use standard mouse movement for viewing.
- Pan mode: Drag the hand pointer to pan in any direction on the page.
- Selection mode: Drag the pointer to select a portion of the page. You can paste the selection in another application that supports pasted text.
- Snapshot mode: Drag the pointer to select a rectangle. You can paste the rectangle in another application that supports pasting images.
- Zoom in: Increases the size of the report.
- Zoom out: Decreases the size of the report.
- Zoom percentage: Selects the viewing size of the report.
- First page: View the first page of the report.
- Previous page: View the previous page in sequential order.
- Page box: Insert a specific page number, which takes you directly to that page.
- Next page: View the next page in sequential order.
- Last page: View the last page of the report.
- Cancel: Stops the report from running. If the report has completed running, this button is dimmed.
- Refresh: Return to the initial view.
- Find: Open the search pane to find a specific text string in the report data.
The sidebar includes three options, accessed with icons at the bottom of the sidebar:
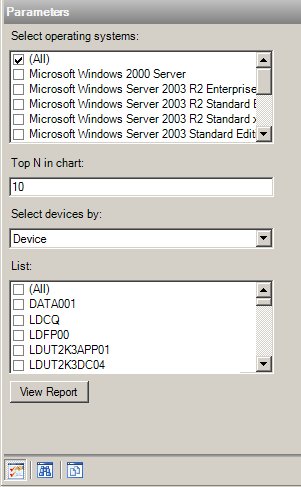
- Parameters:
 Change parameters of the report to select a subset of the data and vary the results depending on how the report is defined. Once you've selected different parameters, click View report to refresh the report with the new parameters.
 - Search results:
 Find a string in the report results. Specify the string and select any criteria (such as Match case), then click Search. A list of occurrences of the string are shown. Click an occurrence to move to that section of the report. The occurrence is highlighted. You can also click a green bar along the right side of the report to move between occurrences.
 - Page thumbnails:
 View thumbnails of the report pages. Click a thumbnail to move to that page.
Selecting parameters from a list
When the sidebar includes a list with parameters, you can include all list items in the report by selecting the All check box. When you do this, the check boxes for individual items are not selected but all are included in the report.
To select a subset of the items, clear the All check box and then select the check box next to each item you want to include in the report.
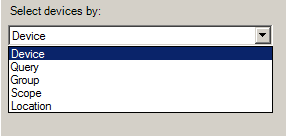
Selecting devices, groups, or locations
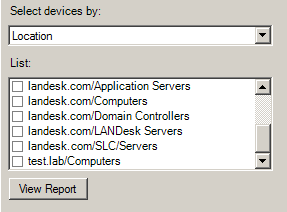
Parameters vary with each report. However, all reports include a device selection option that specifies individual devices, queries, groups, scope, or location. This lets you generate a report for a query, group, or scope that you have defined in the network view, or for a location in your network.
For example, you can select devices in a location based on the device network location. When you select Location, the list displays locations in your network by domain name.
Sub-reports
Some reports can open secondary reports, or sub-reports. Under the Security folder, there are dashboard-style reports for Antivirus and Vulnerabilities. If you open the dashboard report (or parent report), you can click one of the charts to open the corresponding sub-report (or child report).
For example, if you run the Antivirus dashboard report, click the "Real-time scanner status" chart to open a separate report with device scan status. You can then click the Back to parent report button to return to the dashboard report.