Adding a stack bar chart to a dashboard
You can add stack bar charts to a dashboard that enable you to display the results of a query grouped by one attribute, and then grouped again by another attribute.
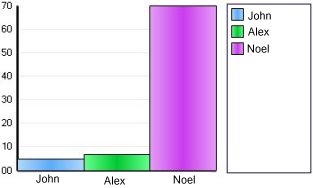
Standard bar chart, with incidents grouped by user
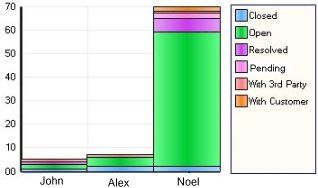
Stack bar chart with each user's incidents grouped by status
To add a stack bar chart to a dashboard:
- Right-click the panel where you want to add the stack bar chart, then click Add Stack Bar Chart Panel.
A stack bar chart panel is added to the panel. - At the bottom of the Dashboard Designer panel, click
 .
.
The Queries tree appears. - Drag the required query onto the Stack Bar Chart panel.
If the query has groups defined, the first two levels of grouping are used as the group and stack attributes. For information about grouping queries, see Adding grouping to query results.
- Right-click the new stack chart panel, then click Panel Properties.
The Stack Bar Chart Properties dialog appears.
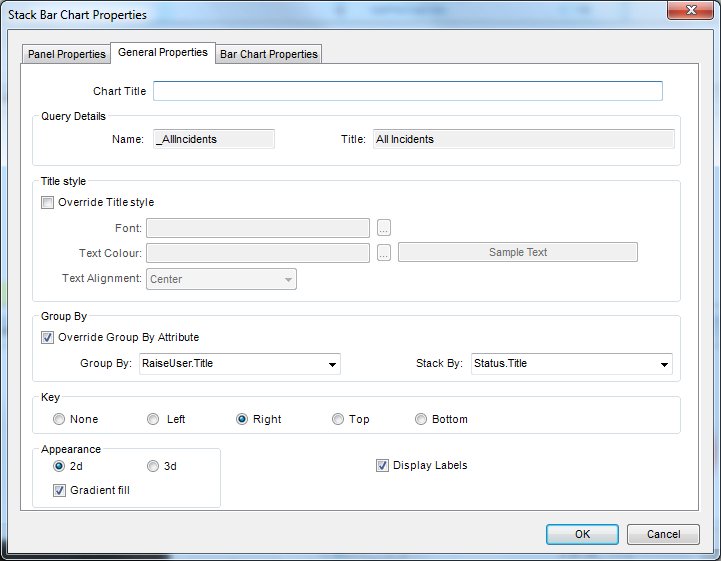
- If the query contains no grouping, or if you want to override the defined groupings for the stack bar chart, select the Override Group By Attribute and select the required Group By and Stack By attributes.
- Complete the remaining fields as required:
Chart Title – type the title you want to appear above the chart.
Title style – enables you to override the default font used for the title bar.
Key – sets the position of the key for the chart.
Appearance – whether the stack bar chart is displayed as a two-dimensional image or a three-dimensional image; for 2d you can specify that the color of the bar has a gradient fill.
Display Labels – toggles the display of the labels on the chart. - Click OK to apply the changes, then click
 to save the changes to the dashboard.
The Panel Properties tab of the Stack Bar Chart Properties dialog enables you to set a title for the dashboard panel, and specify the font and color used on the panel title.
The Bar Chart Properties tab enables you to set the direction of the labels for the bars and specify titles for the chart axes.