Grouping query results and creating charts
You can group a query's results by one of the query attributes at runtime.
To apply grouping to a query:
- In the query results list, right-click the header for the column that you want to group by, then click Group Ascending or Group Descending.
The query results are grouped.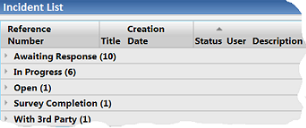

To expand the groups, click  alongside the group.
After you have grouped a query, you can display it as either a pie chart or a bar chart.
To display a grouped query as a chart:
- Run the grouped query as usual.
- In the title bar for the query, click
 , then click View as Pie Chart or View as Bar Chart, as required.
The query results are redisplayed as a chart.
You can add shortcuts to these charts in the same way as you can for any other query. Clicking a segment of a pie chart or a column on a bar chart displays a list that corresponds to the selected group.