Trend charts
You display how your Management Information metrics change over time using the Trend gadget on a Web Access dashboard.
For more information about dashboards and gadgets, see Dashboards. The Trend gadget is available only if you have a license for Management Information.
To add a Trend gadget to a Web Access dashboard:
- In Web Access, display the required dashboard.
- Right-click the column that you want to add the gadget to, then click Add new gadget.
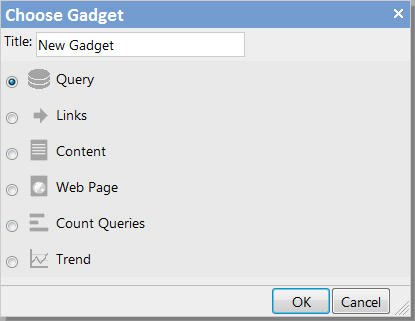
The Choose Gadget dialog appears.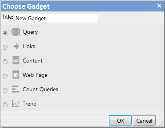
- Click Trend, then click OK.
The Create Trend Gadget dialog appears.
- In the Service Metrics list, select the metric that you want to use on the trend chart.
To help you to identify the required metric, its name in the list is prefixed with the name of the service that it is associated with. - In the Date Interval list, select the time periods that you want to use to group the metric data along the x-axis of the chart.
- In the Date Range fields, select the date from and to for the chart.
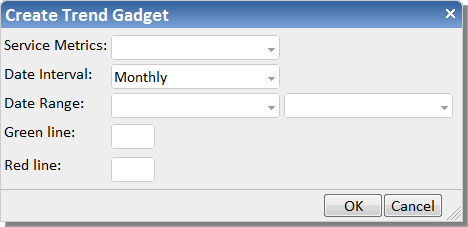
If you leave the first Date Range field blank, the trend chart will display all of the data collected up to the second Date Range field. If you leave the second Date Range field blank, the trend chart will always display the most recent date's data – automatically updating with the new day's data when the page is refreshed.
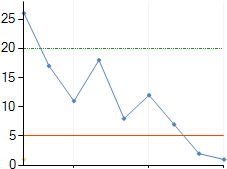
- In the Green line box, type the target value for acceptable performance of the metric.
This value will appear as a dotted horizontal green line on the chart. - In the Red line box, type the value for unacceptable performance of the metric.
This value will appear as a solid horizontal red line on the chart. - Click OK.
The Trend gadget is added to the dashboard.
You can set the properties and configuration details for the gadget or delete it by clicking  in the gadget's title bar.