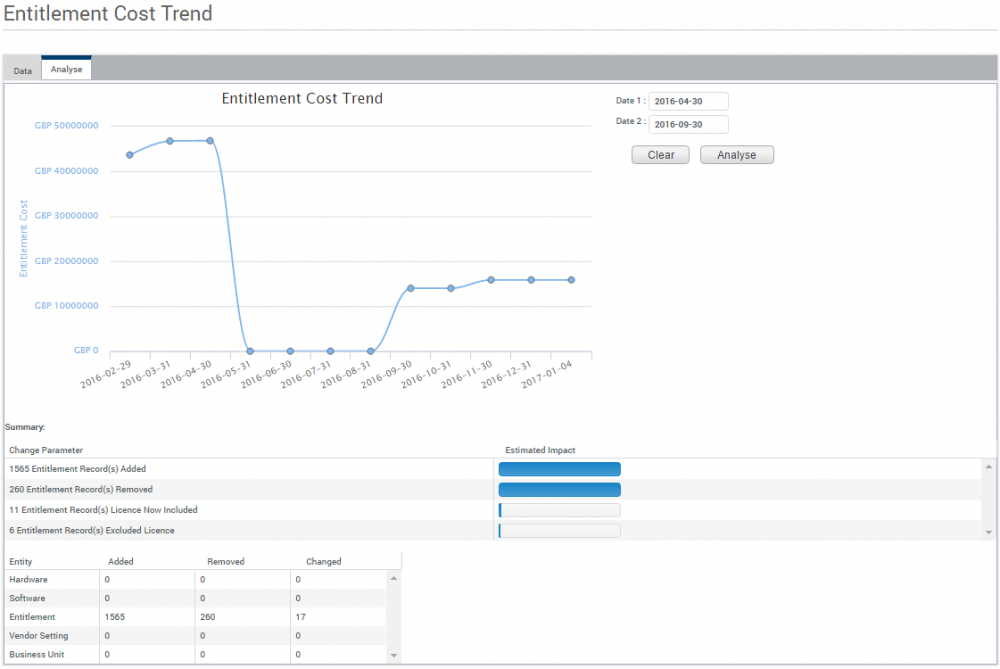
Tile drill-down pages
Clicking a datapoint in a tile from either a dashboard or overview section opens the tile drill-down page in a new window. From here you can see the detailed data behind the overview data shown in the tile. This detail view provides data line items in a grid and analysis functionality shown in a Data tab and an Analyse tab.
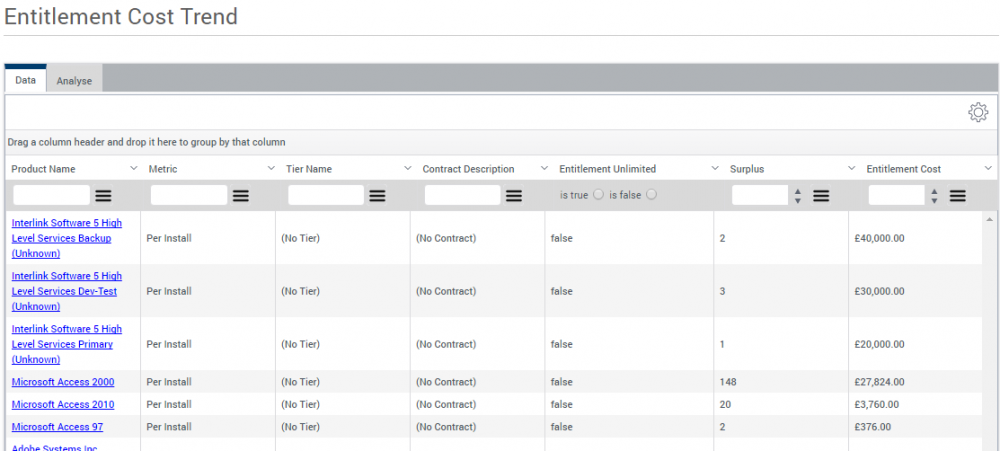
The Data tab displays a data grid of the records that were used to generate the datapoint shown in the overview data view on the tile. You can sort, filter, and export this data as required.
For more information on data grids, see Viewing pages of data.
You can also export the data shown in the data grid from the ![]() menu.
menu.
The Analyse tab displays all of the data from the overview data view shown on the tile. If you pick two data points, License Optimizer provides analysis between the two.