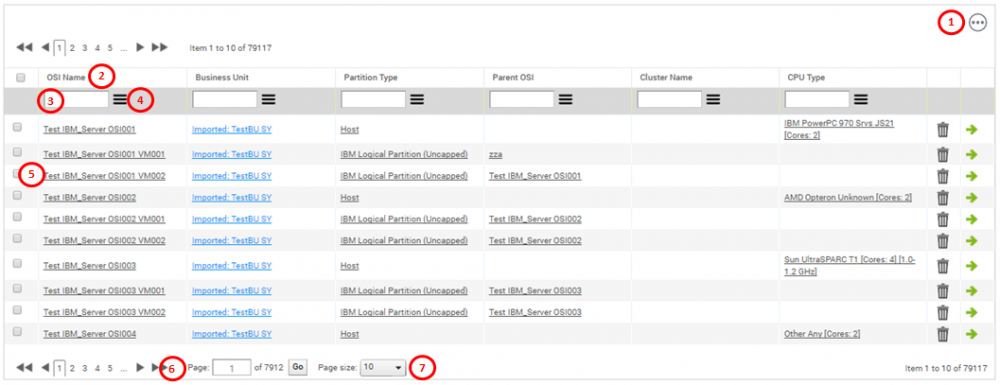
Viewing pages of data
Many of the pages of data in License Optimizer, such as the Hardware or Licenses & Contracts page, can contain a huge amount of data. For performance reasons, these pages are blank when you initially display them, so that you don't have to wait for lots of data that you might not be interested in to appear. These pages include a filter bar at the top so that you can refine the information displayed on the page.

To apply a filter to a page:
1.Click a filter bar button to display the filter values for that option.
2.Select the required filter option and click Apply Now.
The filter is applied and the page updates. The filter indicator icon changes from gray to green, indicating that a filter is in place for the category. Hover over the option to see a tooltip that shows the filter value(s) in place.
3.Use the Search control to search for items in your filtered data grid.
4.Click Clear All to remove all of the filters.
Alternatively, you can select a filter, then click Select Other Filters, and then click Go to apply all of the filters you selected.
Using data grids
License Optimizer displays data in grids so that you can navigate, filter, export data from, and see more information for large volumes of information.
- Column Menu – provides the following commands:
•Clear All Filters
•Export To CSV, Export to Excel – sub-menu options enable you to export all data or just the filtered dataset. For more information, see below.
•Reset Columns – resets the columns to the defaults for the current page.
•Columns – enables you to add or remove columns from the data grid. Arrows at the bottom or top of the sub-menu enable you to scroll to see further columns.
- Column Header – describes the type of content in the column. Clicking the column header toggles sorting by that column. Right-click the column header to display the Column menu.
- Filter Box – enables you to filter the content in a column by typing in the box and either clicking the filter button or pressing ENTER.
- Filter Options – clicking the filter button displays a standard list of Boolean search criteria, enabling you to further refine your search filter.
- Expand Entry – where applicable, a small arrow appears at the start of a row to indicate that there are sub-rows that you can display by clicking the arrow.
- Pagination – with large data sets, the content appears over multiple pages. Click the page numbers or arrows to move between the pages.
- Page size – enables you to configure the number of records displayed on a single page. The default value is 10.
You can export data to a CSV or Excel file, so that you can work with the data in other applications or produce reports as required.
To export data from a grid:
1.Right-click a column header within the grid, or click the Column menu icon.
The Column menu appears.
2.Select either Export to CSV or Export to Excel to set the output file format for the export.
3.Hover over either of the two Export options.
Further options appear in a sub-menu.
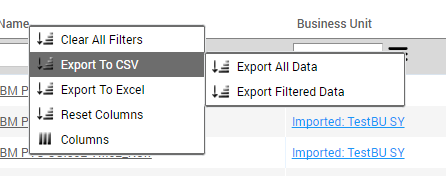
4.Click Export All Data or Export Filtered Data as required. If no filter has been applied to the data, both options export all data.
Overview sections
At the top of many of these pages is an overview section, which you can customize by adding tiles related to the data on that page to create a dashboard. Overview sections are contracted by default when no tiles have been selected. You can expand and contract them using the arrow icons at the right of the pane.
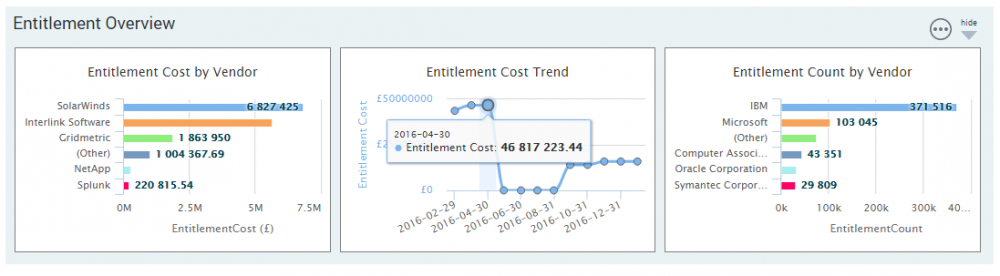
Hover over a data point to display a caption containing details of the data point. Click the caption or a datapoint to display the Tile Drill-down page, which provides details of the overview data shown in the tile. This detail view displays data line items in a grid and provides analysis functionality. For more information on the Tile Drill-down page, see Tile drill-down pages.
License Optimizer retains your preferences so that the same overview section appears when you return to the page.
You can add tiles to an overview section to configure it to match your requirements.
To configure an overview section:
1.Click ![]() to the left of the arrow icon.
to the left of the arrow icon.
The Select Tile dialog appears, showing the tiles that are relevant to the current page.
2.Select or clear the tile option to add or remove tiles from the overview section. Click Clear to clear all selected tiles.
3.When you have selected the required tiles, click OK.
The current page appears with the selected tiles in the overview section.