Defining alerts
You must have alert user rights to access the Alerts list page.
Xtraction enables you to monitor important data points by defining alerts that, when breached, can notify you via email when changes in status occur.
Two types of alert rules are available, and you can set either type to run periodically. After being defined, both types display in the Alerts list page:
•Dashboard alerts: Use when you want notification that a rule was breached at the dashboard level or for individual components on the dashboard. Define these alerts for a dashboard when it's open in the Dashboard Designer. For details on setting up, see About dashboard properties, alerts, and defaults.
•Threshold alerts: Use as standalone rules that check for certain events that occur for specific data-source values. Create these alerts on the Alerts list page.
Threshold alerts
Threshold alerts are standalone alerts independent of any other content within Xtraction. If there's a metric in your reporting data that you want to track or receive notifications for when something significant happens, set up a threshold alert to check the data periodically. For example, you can set a threshold alert to notify you when a Priority 1 incident is about to breach a service level agreement (SLA), which could have significant financial impact on your company.
Unlike dashboard alerts, you create and edit threshold alerts on the Alerts list page.
1.In the toolbox, click the ![]() icon to open the Alert lists page.
icon to open the Alert lists page.
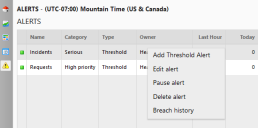
2.Right-click in the list area and select Add threshold alert.
3.Define the alert by entering the appropriate properties under each tab.
General tab: General information that's used to identify and classify an alert.
•Name: The name of the alert rule.
•Category: The category type of this alert rule (for example, Serious or Priority 1).
•Description: An optional description that more thoroughly explains this alert rule.
•Associated dashboard: An optional dashboard that you can associate with the alert if a breach occurs. A link to the dashboard will be sent with the notification.
•After an alert notification: An action that's executed after an alert rule is breached:
•Continue: Resets the alert rule so that it's checked at its next trigger time.
•Delay: Delays the alert check for a specified time period. The alert will continue to be checked after the delay period has elapsed.
•Pause: Pauses the alert after the rule is breached. The alert will not be checked until you manually resume the alert. Do so in the alert list by right-clicking the alert name and selecting Resume alert.
Trigger tab: The trigger controls when the alert will be checked. Currently, all trigger types are time based.
•Timer: The timer runs an alert-rule check at a specified time interval (minutes, hours, or days). Once the timer expires, the alert is checked. Afterward, the timer resets, and the alert will be checked again once the timer period expires.
•Hourly: With an hourly trigger, you select the hours of the day that you want the alert rule checked. The alert is then checked at (approximately) the times selected.
•Daily: The daily trigger checks the alert rule at a particular time each day.
Action tab: When an alert rule is breached, you can set up one of the following actions to occur.
•Email: An email is sent when an alert rule is breached. The following options are available:
•Email addresses: The list of email addresses to send to when the alert breaches. Use a comma to separate multiple addresses.
•Subject: The subject to use in the email. If left blank, the alert name will be the subject.
•Body: The body to use in the email. Depending on the alert type, the body is built dynamically and will include the text entered here, as well as text relevant to the alert breach.
•HTTP request: The URL requested when the alert rule is breached—this action sends off an HTTP Get request. You can include query-string parameters that enable the HTTP endpoint to perform specific actions. A number of variables are available to ensure the URL is dynamically built based on the context of the particular alert. Use the following variables within the URL field:
•{ALERT_ID}: The ID of the breached alert.
•{ALERT_NAME}: The name of the breached alert.
•{USER_ID}: The user ID of the owner of the breached alert.
•{DASHBOARD_URL}: A link to the dashboard associated with the alert (if applicable).
•None: When you don’t want to perform an action after an alert rule is breached, select this option. "None" simply provides a breach history and records the breach value in the database.
Data tab: The data source you want to monitor and details about the alert thresholds.
•Data source: The source of the data to be retrieved.
•Summary type/field: Summary conditions to apply to the sourced data.
•Filter: A filter applied to the data source. Right-click in the Filter area and select a filter option. For details about filters, see Creating filters.
•Breach rule: The rule that determines when the alert has been breached.
4.Click OK when finished.
Alerts list page
To open the Alerts list page, click the ![]() icon in the toolbox.
icon in the toolbox.
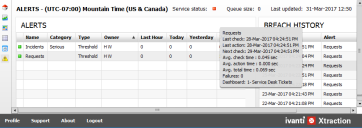
From the alerts list, you can view all dashboard and threshold alert rules that you've personally defined, as well as the breach history list. Administrators can view their own alert rules and breach history list, but also have the option to view alerts defined by all other users. To do so, clear the My alerts only option in the top right corner of the page.
The alerts list also provides statistics on each of the defined alert rules. Hover over the statistics columns (last hour, today, and so on) for more information.
Right-click a listed alert to see or do the following (options will differ depending on the type of alert selected):
•Edit alert: Edit the alert by changing its triggers, actions, or settings.
•Pause alert: Pause the alert so that it won't be checked again until it you manually resume it.
•Resume alert: Unpause an alert. This option updates the status of the alert to active and then resumes checking the alert.
•Delete alert: Delete the alert from the system.
•Breach history: Filter the breach history list to show only breaches for the selected alert.
A separate alert service needs to be on before Xtraction can check alerts and perform actions. At the top right of the alerts list is an indicator showing the status of the service—green shows that the service is running; red indicates that a problem may exist with the service.

The queue size is also displayed, showing how many alerts have been queued for checking. A consistently high queue size indicates that more alerts are defined than can be handled by the alert service.
To turn on the alert service or to enable the service to handle more alerts, ask your administrator to change the settings in the Xtraction Settings utility.
