Queries
When you run a query shortcut from the navigation bar, the corresponding query results page appears to enable you to view and fine-tune the results list. The results list has any specified report templates applied, and is paged as specified in the query design. You can move between the different pages of a results list using the paging controls at the bottom of the page. If the query includes an escalation color indicator, this appears as a color to the left of each row.
If you have the required privilege, you can run actions on a number of items in a query results list at the same time. For information about this, see Bulk actions.
When you first display a query results list on a small device, the first two columns appear; on a larger device, the first six columns appear. If the query includes an escalation color indicator, this always appears as a color to the left of each row. You can change which columns are displayed on a query results list by clicking ![]() in the query header, then selecting the columns that you want to include in the results from the displayed menu.
in the query header, then selecting the columns that you want to include in the results from the displayed menu.
You can change the sort order of the results list by clicking a column heading. An arrow appears in the column heading to indicate the sort order. You can sort by one column at a time only.
Clicking a row in the results list opens the corresponding record.
A filter box appears above each column in a query results list, including the list that appears when you use an add or detach action in a process.

When you type in this box and press ENTER, the query results are filtered to show only those results that contain the text you entered.
The filter box is unavailable for Filter queries created in the Console using the New Filter action in Query and Report Designer.
Queries that are designed to prompt the user for a filter criterion when they are run do not display the prompt in Workspaces and ignore the prompted criterion.
If a query has report templates applied to it to provide additional formatting of the results list,  appears alongside each record. Clicking this icon expands the row to show further information for that record. You can hide this extra information by clicking
  .
.
Exporting query results
You can export your query results to a .CSV file by clicking Export to CSV from the bottom of the ![]() menu.
menu.
Grouped queries
Some queries may have been designed to be grouped by certain attribute values. For example, a list of incidents that are at different statuses can be grouped according to that status. When you run a grouped query, each group appears as a separate tile with the attribute value and number of corresponding records displayed.
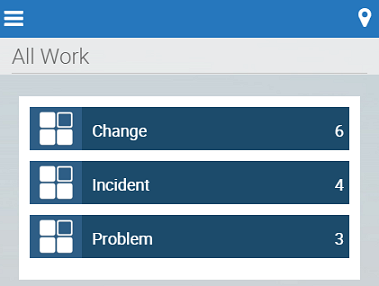
To see the list of records in a group, click the corresponding tile.