Managing Alerts
Managing alerts entails:
- Configuring Alerts
- Modifying Alerts
- Viewing Alert Activity
- Viewing Alert Details
- Creating a Support Ticket, ServiceNow Ticket, or Ticket by Email
- Clearing, Muting, and Unmuting Alerts
- Managing Alert Suppression
Configuring Alerts
You can configure the alerts described in the table below:
|
Alert Setting/Pre-Defined Templates |
Description |
Comments |
|---|---|---|
|
Cert Expiry Alert |
Checks the certificates expiry date and trigger an alert if certificates expiry date is in between defined duration |
We can generate 3 types (Critical , Warning and Information) depending on the defined duration and percentage |
|
CPU Spike Alert (Overview) |
Checks the CPU usage and trigger an alert if there is a spike in the CPU usage and it is between defined percentages and continued for the defined time frame |
We can generate 3 types (Critical , Warning and Information) depending on the defined duration and percentage .We can also define the re-alert interval for this alert |
|
DEP Sync Alert |
Checks for the Device Enrollment Program account Sync status and triggers an alert when sync fails. |
|
|
Device Management Actions Alert |
Checks for the actions taken on the device by admin and triggers an alert on the configured actions or events. |
This alert is available for CORE only. We can configure Critical, Warning and Info level alerts and configure which events should be alerted at which level. Supported Device Action Events are:
|
|
Disk Threshold Alert |
Checks the disk usage and trigger an alert when the disk usage is in between the defined usage percentages |
We can generate 3 types (Critical , Warning and Information) depending on the defined duration and percentage defined |
|
High Number Of 500 Responses Alert |
Checks for HTTP responses and trigger an alert when there are more than 50 HTTP responses with 500 series response codes in the defined timeframe |
Here only warning can be triggered and the response should be for at least defined time frame |
|
Ldap Sync Delay Alert |
Checks the LDAP sync details and trigger an alert, when there is delay in ldap sync between the defined time duration |
We can generate 3 types (Critical , Warning and Information) depending on the defined duration |
|
Ldap Sync Failure Alert |
Checks for the LDAPSync status and triggers an alert if the status is failed |
Only warning will be triggered |
|
Login Failure Alert |
Checks for the login attempts and raises an alert there 5 unsuccessful attempts made in the defined timeframe |
By default there should be more than 5 failed login attempts to generate this alert . We can only generate warning for this alert at defined time frame |
|
Memory Low Alert |
Checks the memory usage and triggers an alert, when the memory usage is in between the defined boundary values |
We can generate 3 types (Critical , Warning and Information) of alerts at defined boundaries and also we can define the realert interval |
|
Mi log error count |
Checks for the mi logs and triggers an alert, when 20 error messages are seen in the defined timeframe |
Here only warning can be triggered if the error logs are recorded for the defined time frame |
|
Mifs Alive Alert |
The alert will be triggered, when MIFS service is not available for the timeframe |
Deprecated. recommends deleting this alert and using the System Service Status alert, instead. |
|
Mifs CPU Spike Alert (Admin portal) |
Checks for CPU usage by process and triggers an alert when there is a spike in tomcat CPU usage for the defined time frame with defined percentage usage |
We can generate 3 types (Critical , Warning and Information) of alerts at defined boundaries and also we can define the realert interval |
|
Mifs Memory Spike Alert |
Checks for the memory usage and triggers an alert, when there is a spike in memory usage for the defined time frame with defined percentage usage |
We can generate 3 types (Critical , Warning and Information) of alerts at defined boundaries and also we can define the realert interval |
|
Provisioning Profile Status Alert |
Checks for the provisioning profile expiration or profile generation failure event and triggers an alert if any of the two conditions are met. |
When Critical alert is created, Monitor will check for the provisioning profile expiration or provisioning profile generation failure events, and trigger an alert if any one of the cases is met. When Warning alert is created, it only checks for the provisioning profile expiration and triggers alert if the expiration matches as per the defined configuration. |
|
QActivation Wait time Alert |
Check for the Q-activation requests and alert is triggered, when QActivation process average wait time falls in the defined timeframe |
We can generate 3 types (Critical , Warning and Information) depending on the defined duration |
|
Sentry ActiveSync 5XX Response Alert |
Checks all the Active Sync responses and triggers an alert, when there are 10 events with 5xx Active Sync responses in the defined timeframe |
We can only generate warning for this alert at defined time frame . |
|
Sentry ActiveSync Blocked Request Alert |
Checks the Active Sync requests and triggers an alert, when 10 Active Sync requests are blocked on Sentry in the defined timeframe |
We can only generate warning for this alert at defined time frame . |
|
Sentry AppTunnel 5XX Response Alert |
Checks all the App Tunnel responses and triggers an alert, when there are 5 events with 5xx App Tunnel responses in the defined timeframe |
We can only generate warning for this alert at defined time frame . |
|
Sentry AppTunnel Blocked Request Alert |
Checks all the App Tunnel responses and triggers an alert, when 10 App Tunnel requests are blocked on Sentry in the defined timeframe |
We can only generate warning for this alert at defined time frame . |
|
Server Response Latency Alert |
Checks the HTTPS responses and triggers an alert, when there are 10 responses with response time greater than the defined time and in the defined timeframe |
Here warning will be triggered |
|
Services Connectivity Status Alert |
Checks Core & Sentry application services and triggers an alert when the status of the services changed. Alert engine will remember the status until timeframe defined |
We can only generate warning for this alert at defined time frame . |
|
Checks for the System services status and triggers an alert upon changed status. Service monitored:
|
This alert is available for Core instances only. You need to enable these alerts in RDB. See "Managing monitoring the monitor server" in the Reporting Database (RDB) Essentials Guide. |
|
|
VPP Sync Alert |
Checks for the Volume Purchase Program account Sync status and triggers an alert then sync fails. |
|
To configure alerts:
Procedure
-
Click Alerts.
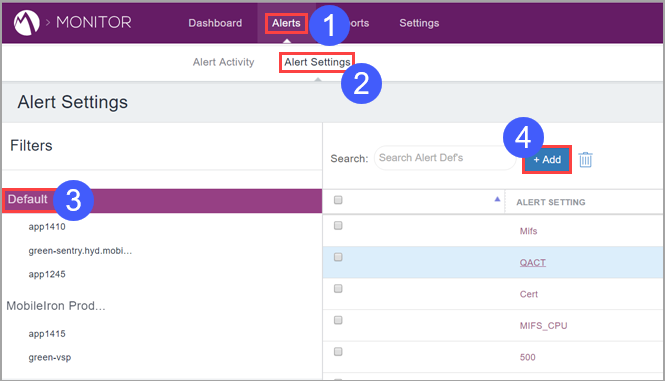
- Click Alert Settings.
- Select the server group for which to configure alerts.
- Click +Add.
- Use the controls on the resultant page to create alert settings, clicking Next on the right side of the page after completing each step.
- Click Save.
Modifying Alerts
To modify the behavior of an individual alert:
Procedure
-
Click Alerts.

- Select Alert Settings.
- Select a server group.
-
Click an alert to modify.
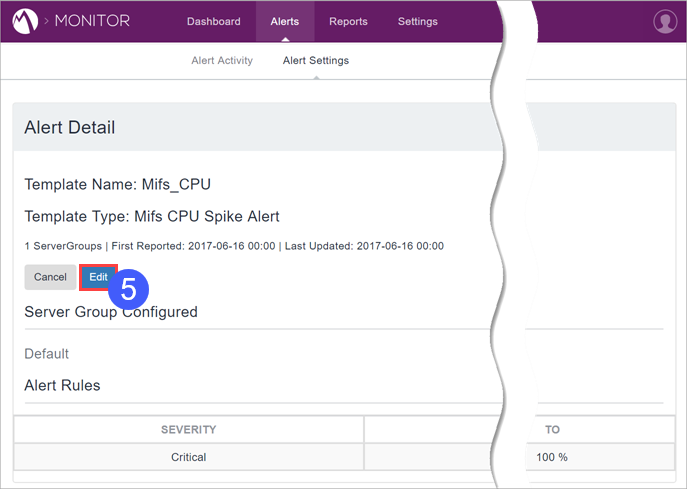
- Click Edit.
- Use the resultant fields to modify the alert.
- Click Save.
Viewing Alert Activity
To view alert activity:
Procedure
-
Click Alerts.
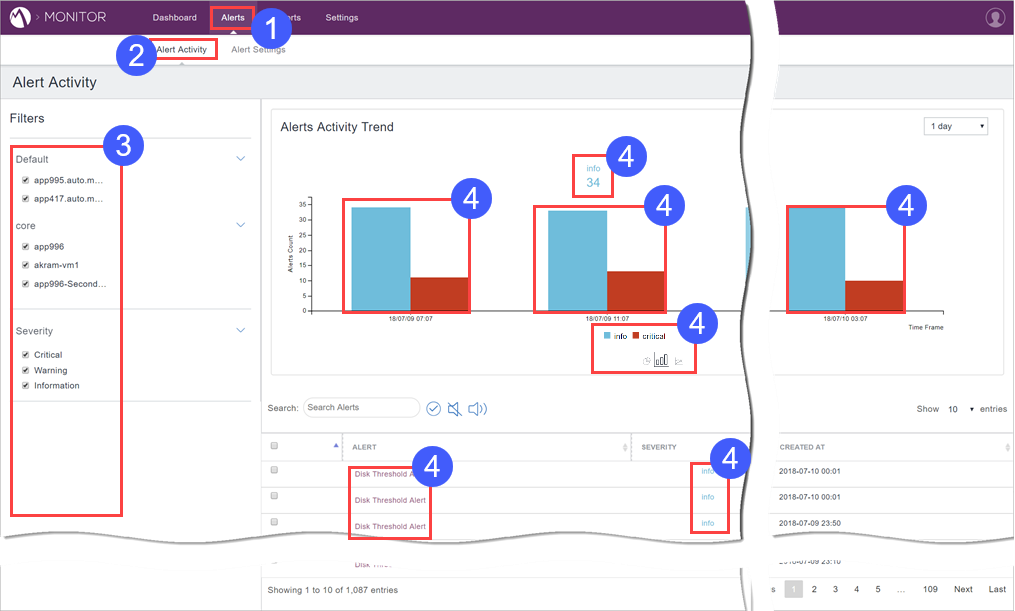
- Select Alert Activity.
- Select the servers and the severities for which to view alert activity.
- Click the live links on the page to interact with the page and drill down to further details.
Viewing Alert Details
To view alert details:
Procedure
-
Navigate to the Alert Activity page as described in Viewing Alert Activity.
-
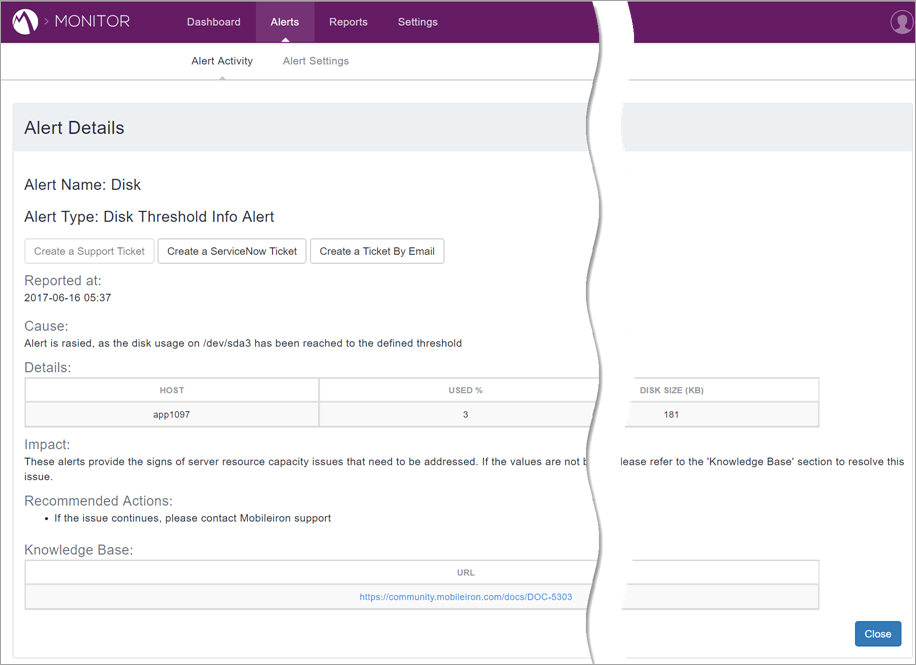
Click an alert whose details to view.
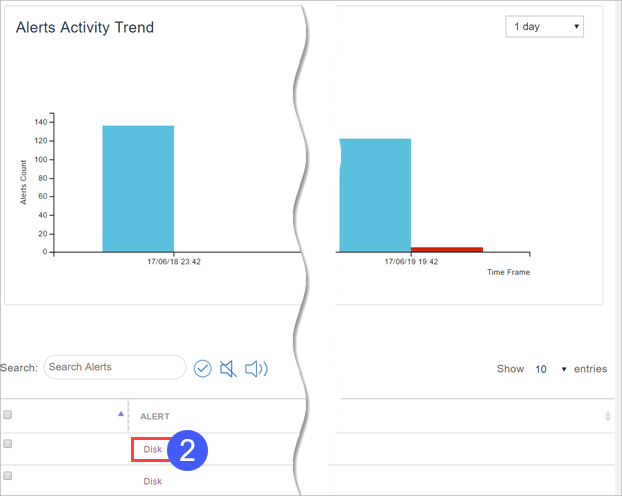
-
The Alert Details page appears:
Creating a Support Ticket, ServiceNow Ticket, or Ticket by Email
To create a support ticket, ServiceNow ticket, or ticket by email:
Procedure
-
Navigate to the Alert Details page as described in Viewing Alert Details.
-
Click the Create a Support Ticket, Create a ServiceNow Ticket, or Create a Ticket by Email button, and then follow the resultant prompts on the screen.
Clearing, Muting, and Unmuting Alerts
To clear, mute, or unmute alerts:
Procedure
-
Click Alerts.
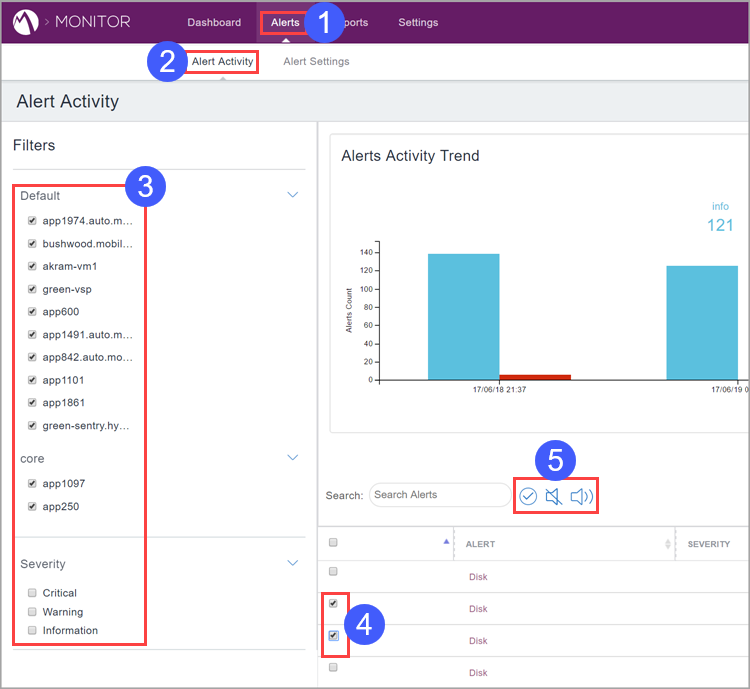
- Click Alert Activity.
- Select the target server groups and severities.
- Select the alerts to clear, mute, or unmute.
- Click the clear,
 , mute,
  ,
or unmute,
  , icon.