Activity Monitoring
Several visual traffic monitoring tools allow you to keep track of the current and past activity on your system. To access these tools, click the Activity button on the top bar of the Admin UI.
Activity > Current Activity
The “Current Activity” page shows you a real-time graph of the traffic activity on your system. You can customize the data extensively.
You can choose some standard sets of data to plot, traffic values such as current bandwidth, number of connections the Virtual Traffic Manager processes or hardware values such as free memory or spare CPU time. Much of this information can be split by virtual server, by pool, or by node. You can also dictate the size of the graph, the timescale, and choose between linear and logarithmic axes, or a pie chart. You can graph across all the machines or one at a time.
When you have chosen your settings, click Plot Data to view the graph. You can also download the data as a .tsv (tab-separated variable) file for your own analysis.
To further customize the data on the graph, click the Change Data button. This takes you to the Current Activity > Edit page where you can specify the data to plot.
In the “Global Values” section you can choose statistics to monitor and plot for the system as a whole. The “Virtual Server Values”, “Pool Values” and “Node Values” sections allow you to plot data split into individual instances of these. You can view data transfer and connection counts as well as DNS and SNMP request data, content compression and HTTP rewrites.
The “Service Protection Class Values” section allows you to plot information about requests rejected by service protection classes. You can view data for all or a subset of your service protection classes, and split the data by the reason for rejection, such as the connection count from a single IP address being too high or the request containing disallowed content.
When you have chosen the settings to plot, you can save them to use again later. When you have finished, click Apply.
Monitoring Performance Using SNMP
Simple Network Management Protocol (SNMP) is an open standard for network monitoring and management. It can allow you to monitor devices on a network and gather performance data.
The Virtual Traffic Manager supports multiple SNMP versions: v1,v2c and v3.
The Virtual Traffic Manager allows you to monitor performance using an SNMP tool such as HP OpenView™. You can extract information about the traffic flow for your own analysis.
The Virtual Traffic Manager is also capable of sending asynchronous SNMP notifications, known as SNMP Traps. For more details, see Event Handling and Alerts.
To configure SNMP, click System > SNMP. Here you can download the relevant Virtual Traffic Manager MIB (Management Information Base) for your chosen SNMP version. The MIB is a database of the information used by SNMP, and comes in two SMI (Structure of Managed Information) versions:
•SMIv1: for SNMPv1 clients only
•SMIv2: for SNMPv2c and v3 clients only
Either click the link to view the MIB in your browser, or right-click to save the contents to a file on your computer.
Common SNMP Settings
To enable SNMP, set snmp!enabled to “Yes” and click Update.
You can configure common settings such as the port and bind IP address the SNMP service should listen on, and the clients that should be allowed to access the service.
The standard port for SNMP is 161, but if you wish to use an unprivileged port then 1161 is a good alternative.
SNMPv1 and SNMPv2c Settings
You can configure the following settings:
|
Setting |
Description |
|
snmp!community |
In order to function correctly, the SNMP server must have a suitable community string. This is the equivalent of a password, and identifies authorized SNMP requests. It is not secure, as it is transmitted in the SNMP request as plain text, so you should not use a sensitive secret as the community string. The default value for many SNMP clients is “public”. Since the Virtual Traffic Manager can restrict access to the SNMP service, the strength of this secret is not a major concern. Leaving the community string blank/empty will cause all SNMPv1 and SNMPv2c commands to be rejected. |
SNMPv3 Settings
This section allows you to specify the authentication and privacy settings for accepting and responding to SNMPv3 commands.
One ingredient involved in the generation of cryptographic keys from passwords is the so-called “Engine ID”. The Virtual Traffic Manager generates this value using a combination of the Zeus1 enterprise OID (7146) and the first MAC address on the machine it is running on. The correct Engine ID value for the Virtual Traffic Manager you are connected to is displayed in this section.
All SNMPv3 communication is checked against the user settings that follow, and commands whose security parameters do not exactly match are rejected. (However, snmpEngineID discovery messages, which are never authenticated and which may be sent with an empty username, are permitted and responded to).
You can configure the following settings:
|
Setting |
Description |
|
snmp!username |
This is the SNMPv3 user's username, required for all SNMPv3 commands and communication. If you set this to blank/empty, all SNMPv3 commands will be rejected. The Virtual Traffic Manager requires and permits a single SNMPv3 user account to be defined. Authentication and privacy settings for this user are defined according to the fields that follow, and are based on the “User-based Security Model” described in RFC3414 (http://www.ietf.org/rfc/rfc3414.txt). |
|
snmp!security_level |
The SNMPv3 user's choice of whether to use authentication, and whether to use privacy. SNMPv3 commands must obey this choice, or they are rejected. SNMPv3 responses obey this choice. Selecting Authentication here means that commands and responses are cryptographically signed with a key derived from snmp!auth_password, and this signature is included in the message. Incorrectly signed commands or responses are detected and rejected. This is intended to prevent an imposter masquerading as a trusted party, as long as the password remains secret. Additionally selecting Privacy here means that parts of commands and responses are encrypted using DES with a key derived from the snmp!priv_password. This is intended to prevent an eavesdropper from reading the content of messages, as long as the password remains secret. |
|
snmp!hash_alg |
This is the SNMPv3 user's choice of cryptographic hash algorithm, required for SNMPv3 commands and used for responses. Supported hash algorithms are MD5 and SHA-1. See RFC 3414 for details (http://www.ietf.org/rfc/rfc3414.txt). If you set snmp!security_level to "No Authentication, No Privacy", this setting is not used. |
|
snmp!auth_password |
The SNMPv3 user's password for authentication. This is a shared secret; you should configure your SNMP client user account with the same authentication password. The authentication key for SNMPv3 communication is derived from this password. If you set snmp!security_level to "No Authentication, No Privacy", this setting is not used. |
|
snmp!priv_password |
The SNMPv3 user's password for privacy (message encryption). This is a shared secret; you should configure your SNMP client user account with the same privacy password. The privacy key for SNMPv3 communication is derived from this password. Re-using your authentication password here is not recommended for security reasons. If you set snmp!security_level to "No Authentication, No Privacy", or "Authentication only", this password is not used. |
Custom Performance and Event Monitoring
The counter.increment() TrafficScript function is used to increment one of 10 built-in counters.
You can retrieve the values of these counters using SNMP, and you can graph them in the Activity Monitor.
These counters can be used to record custom events that you detect using TrafficScript. For example:
•If you perform authentication in a TrafficScript rule, you could count the number of authentication failures.
•If a particular class of request is particularly resource heavy, you could chart the number of times that request is made.
•If you perform security checking, for example, for a known Web worm signature, you could count and chart the number of times the signature was found.
You can increase the number of built-in SNMP counters by changing the snmp_user_counters value located in System > Global Settings > Other Settings.
Activity > Historical Activity
By default, the Virtual Traffic Manager records system activity for the past 90 days. To change the number of days for which data is stored, click System > Global Settings > Other Settings and modify the number stored in statd!days. A value of 0 instructs the Virtual Traffic Manager to keep data indefinitely.
To view historical system activity, click Activity > Historical Activity.
Select a graph of hits per minute or bits processed per second, displayed by virtual server, pool, or node. The Virtual Traffic Manager offers a range of timescales for the data you want to plot from 1 hour up to 1 year, although the options available are affected by the value set in statd!days.
Choose to plot data for all virtual servers, pools, or nodes in the system, or for a selected subset. Choose also the chart size and axis type.
Click Plot Data to view the graph using the current setting. You can also download the data as a ".tsv" (tab-separated variable) file for your own analysis.
Activity > Map
The map provides a view of the geographic origin of requests being handled by your traffic management system.
The map is designed to be interactive and tools are provided to move around and zoom into a level of detail required for your infrastructure. You can center the map on a geographic location of your choice by holding down the left-hand mouse button and dragging the map to your required destination.
Each small dot that appears on the map represents a user who has issued a request for a particular service.
To enable the map to show activity corresponding to user locations, the Virtual Traffic Manager requires access to a GeoIP database. For more information, see Using a GeoIP Database.
Activity > Connections
This functionality described in this section is individually license-controlled. Some licenses provide a Basic functionality mode only, with simple connection information, fewer customization options and a single filter. A Full mode that supports all the features described here is available under the “advanced real-time analytics” license option. Contact your support provider if you wish to purchase this option.
Basic Mode
The Connections page gives you the ability to monitor current and recent connections being handled by the Virtual Traffic Manager, in date order (most recent first). This is a snapshot of connections from a point in time, where all connections after that time will not be displayed until the Refresh Snapshot button is pressed.
You can show and hide field columns using the [+] button in the top left of the connections table. This displays a drop-down list of fields that the table is currently displaying. Clicking on each field in this list toggles it between being displayed or hidden.
A simple filter can be applied to the displayed data to show connections only to a specific node (the “To” column). This is a single-field version of the filter functionality available in the Full mode. Refer to the usage instructions described next.
Full Mode
In this mode all of the above features are present, with additional connection detail and customization now available. You can apply a sort to the displayed data by clicking on the column heading you wish to sort by. A small arrow next to the sorted column indicates the direction of sort. You can toggle this between ascending and descending by clicking on it.
In addition to the node filter, you can now filter the connections by any field or data in the table. This can be achieved via the drop-down box in the filter section at the top of the page, or by clicking directly on one of the data values in the table. This second method produces an in-line “add filter” dialog that allows you to filter away all connections that do not share the value of the selected field.
For example, suppose you want to see requests that originate from a specific IP address and port that result in an HTTP response code of 200. First click the IP address you wish to use in the “From” column. A filter popup will appear, populated with the selected IP:
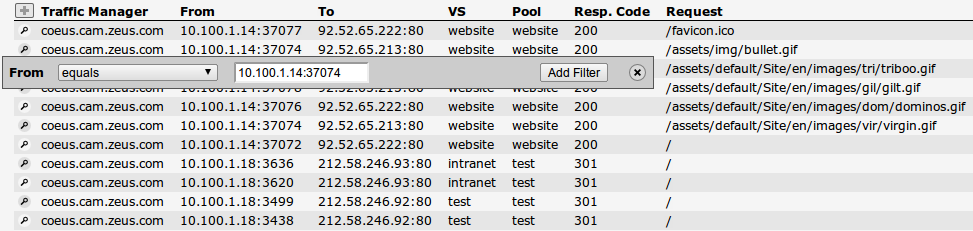
Click the Filter button to apply the described logic. This filter is added to the “Active Filters” display at the top of the page. Now click the value “200” in the “Resp. Code” column and apply a filter to this. You should now see only the desired connections.

Adjustments can be made to the active filters by making a change and then clicking the Update Filters button to redisplay the connection data. To remove a filter, tick the checkbox next to the criteria that you want to remove, and click Update Filters. All filters can be removed by clicking Clear Filters.
The Refresh button can be used to update the results snapshot, and the Download button provides a .tsv (tab separated value) file of the results for analysis in other applications.
Furthermore, clicking on the magnifying glass icon to the left of each line provides additional details for a specific connection:
|
Section |
Description |
|
Request tracing |
This section gives you a timeline of internal connection processing events. This can show you how long the entire request took, how much of that time was spent processing TrafficScript rules, and other useful information. This information will recorded only if the request_tracing!enabled key is enabled for the virtual server that processed the connection. For further information, see Connection Analytics. |
|
Request details |
This section shows you all of the request headers that the request contained. |
|
Response details |
This section shows you all of the response headers (including those that may have been added by TrafficScript or verbose cache logging). |
You can increase the size of the Connections snapshot using the System > Global Settings page; look in the “Logging” section for the recent_conns key.
Activity > Draining Nodes
If you want to remove a node from the system, for instance for maintenance or upgrade, you can set it to “drain”. The node will continue to handle any existing sessions, but the Virtual Traffic Manager will not send it any more connections. The “Draining Nodes” section shows information about any nodes you are currently draining.
For each draining node, the page shows the time since the last connection, and the current number of active connections. You can update the information by clicking Reload This Page.
When all the active sessions have expired, it is safe to remove the node; you can do this via the Pools > Edit page or use the Remove a Node wizard.
For further information, please refer to the description of node draining in the Draining, Disabling, or Removing a Node.
Activity > View Logs
Virtual servers may be configured to log all transactions to a Request Log. In the Virtual Server > Request Logging page (see Request Logging), you may configure what information is logged, and where the log files are written to.
The Activity > View Logs page allows you to watch the request logs in real-time as records are appended to them.
Virtual Traffic Manager virtual and cloud instances are self-contained and have a dedicated, self-managed log partition. Log files are stored in this partition, archived and deleted automatically. You do not need to configure the location where request log files are stored.
Log files can be viewed using the Activity > View Logs page, and can be downloaded using the Activity > Download Logs page. You can also use the Virtual Traffic Manager “Control API” to download and manage log files on Virtual Traffic Manager virtual/cloud instances.