Exporting Analytics to a Remote Service
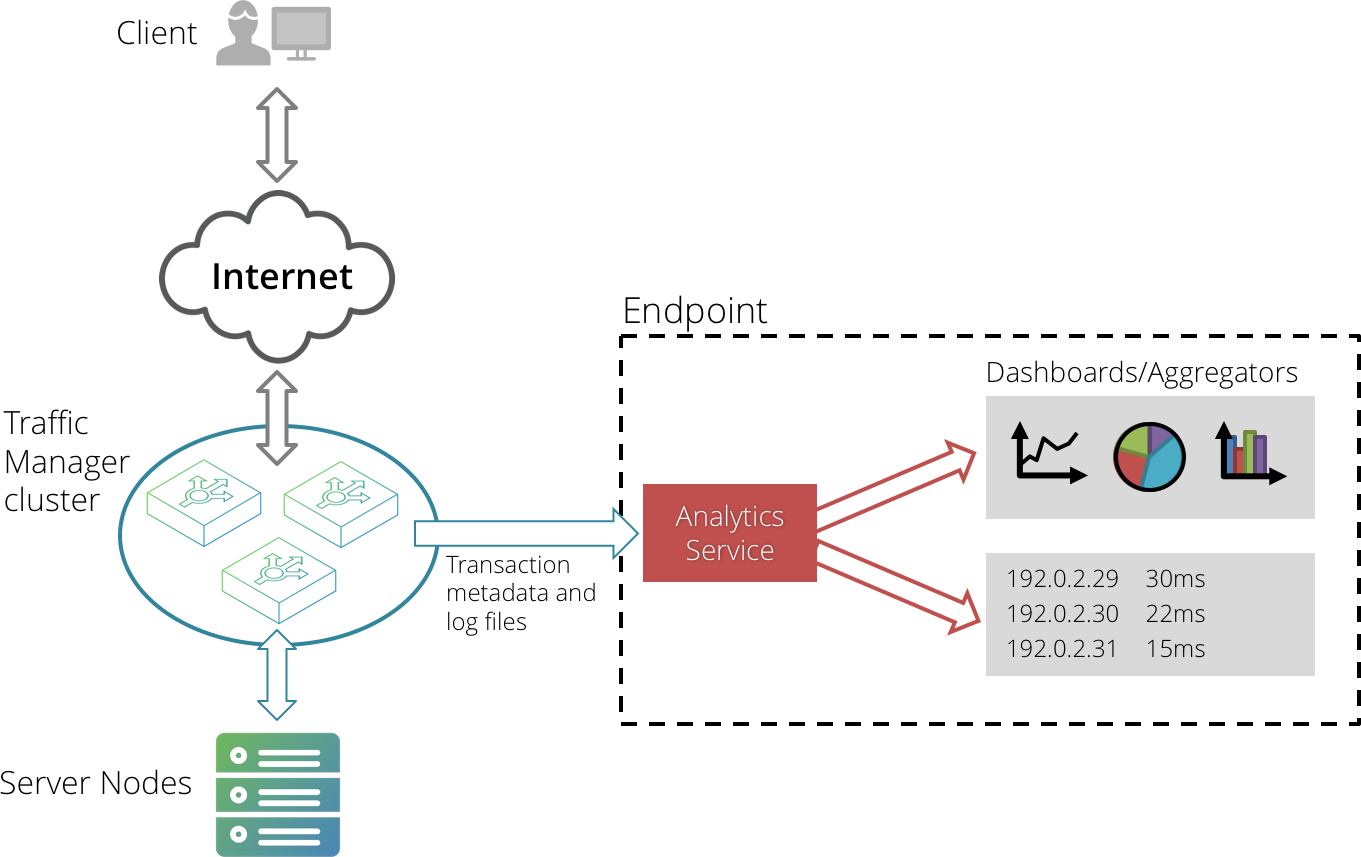
Your Virtual Traffic Manager cluster can export metadata for transactions handled by your virtual servers, and stored log data, to an external source for offline analysis.
Transaction metadata is information about individual transactions processed by the Virtual Traffic Manager, such as an HTTP request or the communication between a client and server over a generic TCP connection.
This information can provide detailed visibility into the health and efficiency of the services running on your cluster, or to facilitate debugging in the event of unexpected service behavior.
The Virtual Traffic Manager allows you to remotely stream the following data types:
•Metadata for all transactions handled by a virtual server and recorded on the Activity > Connections page.
•A configurable set of log files stored on the Virtual Traffic Manager cluster.
•SNMP counters
SNMP counters are available to any SNMP-ready service as a standard method of monitoring the activity of your Virtual Traffic Manager, and not strictly a configurable part of the analytics export capability. For more information on SNMP, see Activity Monitoring.
To receive the analytics data exported from a Virtual Traffic Manager, your endpoint should employ an analytics service that supports ingestion of data in JSON format through TCP streams (for transaction metadata) and POST requests (for log data). You configure the Virtual Traffic Manager with the IP address and port on which the analytics service is listening, and the URL to which exported log data is sent.
To configure transaction analytics and log data export settings, click System > Analytics Export.
For settings that control exporting transaction metadata, use the "Transaction Metadata" section. For settings that control exporting log data, use the "Log Files" section.
Analytics Export settings are shared with every Virtual Traffic Manager in the same cluster. Consequently, any changes you make to one cluster member are automatically replicated out to all other members.
Configuring Export Settings for Transaction Metadata Records
The Virtual Traffic Manager maintains a series of long-lived TCP connections to the endpoint, with each connection managed by an internal data-plane process. The data-plane processes handle incoming transactions with the Virtual Traffic Manager and stream corresponding metadata records in JSON format, separated by newline characters, to the endpoint.
If a connection to the endpoint fails for any reason, all unsent metadata records are typically dropped. The Virtual Traffic Manager maintains an SNMP counter to track the number of records that it was unable to export.
Use the Transaction Metadata settings to configure how the Virtual Traffic Manager exports transaction metadata records to the defined endpoint.
![]()
To view the JSON schema the Virtual Traffic Manager uses when streaming transaction metadata, click View JSON Schema for transaction metadata. Use this schema to configure your analytics service with the structure of metadata records it should expect.
The Transaction Metadata section contains the following configuration keys:
|
Key |
Description |
|
transaction_export!enabled |
Enables the cluster-wide connection to the external endpoint configured in transaction_export!endpoint. If enabled, the Virtual Traffic Manager exports metadata for all transactions handled by virtual servers on which the equivalent setting is enabled. If disabled, the Virtual Traffic Manager exports no transaction metadata regardless of individual virtual server settings. To view and modify individual virtual server export settings, see Exporting Transaction Metadata. |
|
transaction_export!endpoint |
The endpoint to which the Virtual Traffic Manager sends analytics data. Use the format <hostname>:<port> where <hostname> is a hostname or IPv4/IPv6 address, and <port> is a port number. Literal IPv6 addresses must be enclosed in square brackets. For example, "[fe80::1]:5000". If you specify a hostname, the Virtual Traffic Manager uses this as the Server Name Indication in the TLS handshake. The endpoint must be configured to receive JSON events through a TCP socket. It is not an HTTP endpoint. |
|
transaction_export!tls |
Enables TLS encryption for the connection to the endpoint. If enabled, the settings contained in System > Global Settings > SSL Configuration are applicable to the connection. Transaction metadata records might contain confidential or user identifying information, depending on the application. To maintain confidentiality on production systems, make sure the connection to the analytics service is encrypted and verified (see also transaction_export!tls_verify). Ivanti strongly recommends disabling TLS encryption only for testing in a development environment. |
|
transaction_export!tls_verify |
Enables verification of the endpoint's TLS server certificate against Certificate Authority (CA) certificates present in the Virtual Traffic Manager's "Certificate Authorities and Certificate Revocation Lists" catalog. This setting ensures the Virtual Traffic Manager disallows server certificates that do not match the server name, are self-signed, expired, revoked, or have an unknown CA. |
For additional per-service configuration, use the Connection Analytics section on the desired virtual server Edit page. Use these settings to disable or limit analytics exporting for specific virtual servers, and thus to limit the overall volume of data exported by the Virtual Traffic Manager. For more information, see Exporting Transaction Metadata.
Configuring Export Settings for Log Files
Use the Log Files section to configure how the Virtual Traffic Manager exports log data to the defined endpoint.
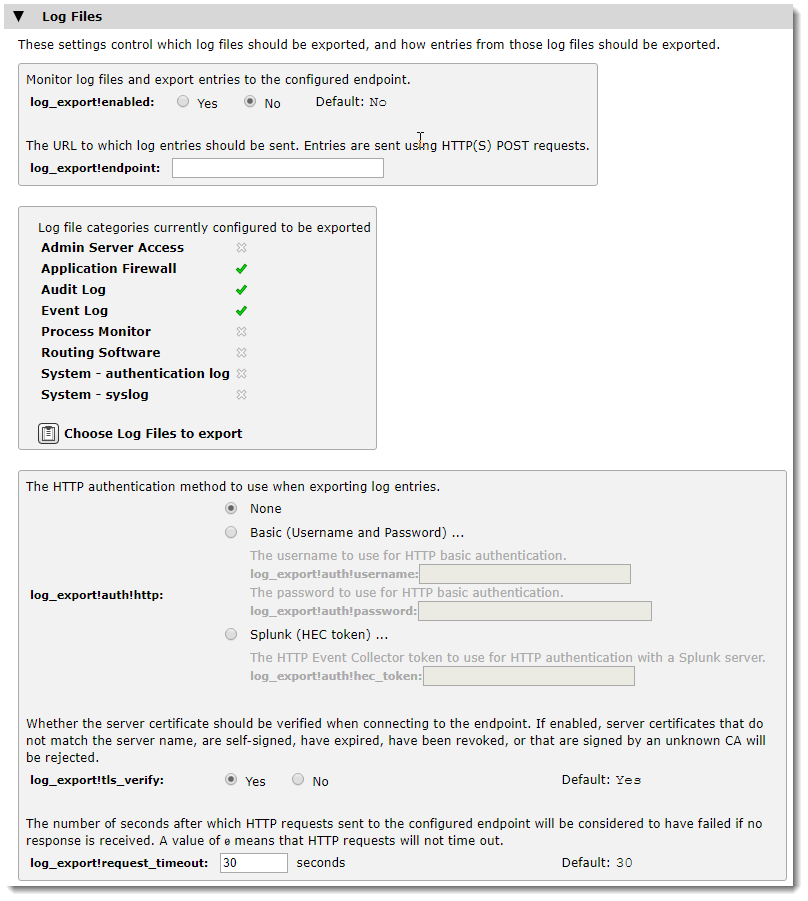
The Virtual Traffic Manager provides a summary list of log file categories currently included or excluded from the export set. To configure the list of log file categories, click Choose Log Files to export.
The Log Files section contains the following configuration keys:
|
Key |
Description |
|
log_export!enabled |
Enables the connection to the configured endpoint for log file exporting. If enabled, log data is sent over HTTP connections to the endpoint URL contained in log_export!endpoint. Before you enable log file exporting, review the list of log file categories to be exported from the Virtual Traffic Manager. For more information, see Selecting Log File Categories to Export. |
|
log_export!endpoint |
The URL of the endpoint to which the Virtual Traffic Manager sends log data. The endpoint must be an http or https based URL configured to receive HTTP post requests containing one or more JSON encoded events. |
|
log_export!auth!http |
The type of HTTP authentication the Virtual Traffic Manager should use with its connection to the endpoint. Choose one of the following methods: "None": Use no authentication method. "Basic": Use HTTP basic authentication. Specify the required credentials in log_export!auth!username and log_export!auth!password. "Splunk": Use an HEC token for HTTP authentication with a Splunk® server. Specify your token in log_export!auth!hec_token. |
|
log_export!tls_verify |
Enables verification of the configured endpoint's TLS server certificate against Certificate Authority (CA) certificates present in the Virtual Traffic Manager's "Certificate Authorities and Certificate Revocation Lists" catalog. This setting ensures the Virtual Traffic Manager disallows server certificates that do not match the server name, are self-signed, expired, revoked, or have an unknown CA. |
|
log_export!request_timeout |
The time limit, in seconds, after which the Virtual Traffic Manager considers the connection to have failed. Use this setting to specify a time limit for the Virtual Traffic Manager to process each POST request. This can be useful to detect a malfunction in the analytics service operating at the endpoint. To specify no limit, use a value of 0. |
Selecting Log File Categories to Export
Use the Log File Export Categories page to include, exclude, or modify the categories of logs contained on your Virtual Traffic Manager as part of the export set.
A log file category corresponds to a set of related log files stored on the Virtual Traffic Manager system. As standard, the Virtual Traffic Manager provides several built-in log categories applicable to all product variants.
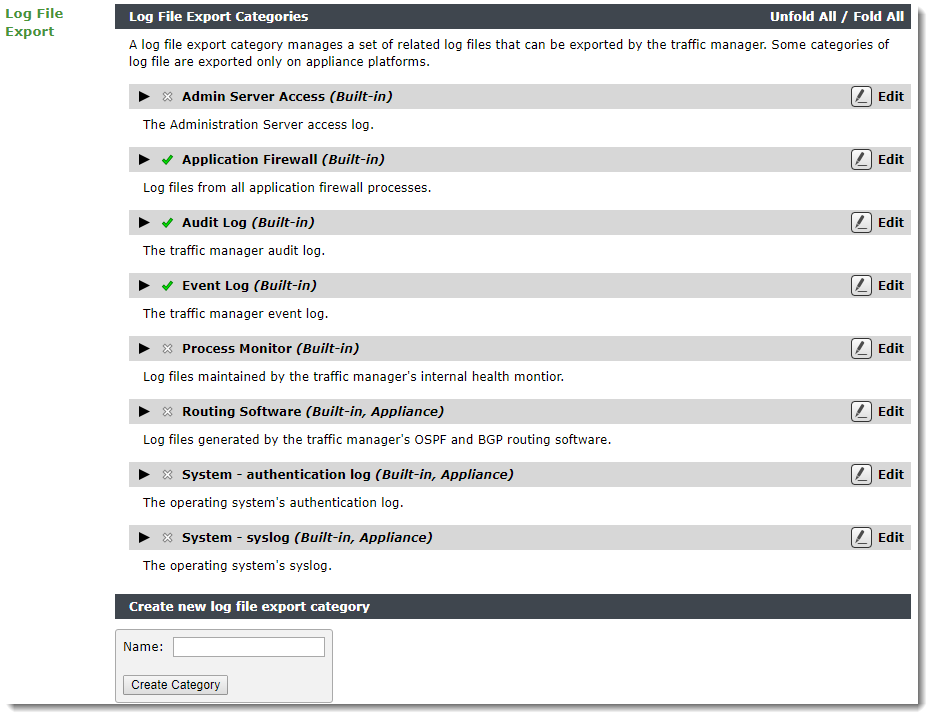
Each item in the list marked "Built-in" represents a standard Virtual Traffic Manager log export category. The tick icon refers to those logs marked to be included in the export set. The cross icon indicates a log that is currently excluded.
A tag of "Appliance" after the log name indicates a log category that is exported only for Virtual Traffic Manager appliance variants.
To export additional log categories, perhaps belonging to other processes running on the same system as the Virtual Traffic Manager, add a new log type in the "Create new log file export category" section. Then, configure the log location on the Log Export Category edit page.
Editing Log Export Categories
To include or exclude a log category from the export, or to set other configurable details, click Edit alongside the log name to edit the log export category properties.
The edit page contains the following configuration keys:
|
Key |
Description |
|
enabled |
Includes this log category in the export set. |
|
appliance_only |
Export this log category only for Virtual Traffic Manager appliance variants. |
|
files |
The set of glob patterns to select the log file and any rotated (historic) versions the Virtual Traffic Manager should include in the export set. |
|
note |
A free text description for this log category. |
|
history |
How much historic activity for this log should the Traffic Manger export. Use one of the following values: "Do not export any historic entries": Ignore all historic activity logs and use only current activity logs in the export. "Export all historic entries": Include all current and historic activity logs in the export. "Export recent historic entries, according to the history_period setting": Include historic activity up to the number days set in history_period. |
Configuring Metadata Tags for Log Records
Use the Metadata section to define a set of machine-readable name/value pairs to be appended to the records sent to the endpoint for this log category.
Edit your metadata tags to suit the requirements of the remote analytics service. To ensure the output of each log category is individually identifiable, make sure each log category has a unique set of metadata tags defined. Otherwise, the analytics service cannot determine which records belong to which group of log files. Refer to the documentation for your analytics service to determine which record tags might be needed.
The Virtual Traffic Manager supports nested metadata tags to implement grouping of related data objects. To nest your tags, use a period (.) as the separator, as in the form "<first part>.<second part>.<third part>.<etc.>". For example, "fields.format".
The Virtual Traffic Manager additionally supports two special macros which, when specified in your metadata tag values, are replaced in the log records with the corresponding identifier:
•%cluster_id%: the identifier for your Virtual Traffic Manager cluster.
•%instance_id%: the identifier for the Virtual Traffic Manager instance that recorded the log entry.
Built-in log categories include a number of predefined metadata tags by default. These tags are optional and can be removed by selecting the Remove checkbox adjacent to each tag. Click Update to complete the action.
The predefined tags are:
•source: a text name that describes the source of the log, used to facilitate searching for records in the analytics service. For example, "eventlog" identifies entries exported from the Virtual Traffic Manager's Event Log.
•sourcetype: a text definition of the log format, used by the analytics service to guide parsing and extraction of fields. For example, "zxtm_event_log" indicates that the information contained in the main "event" parameter of the exported records is in the format of the Virtual Traffic Manager's Event Log.