Layout of the Administration Interface
The administration interface consists of the following sections:
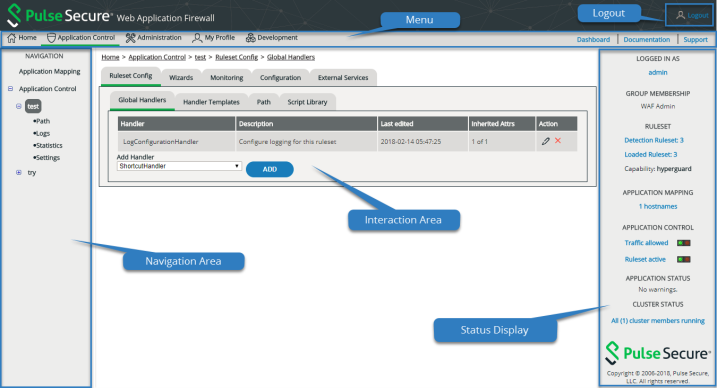
Menu
The menu provides access to the different groups of functions:
- Home:
Goes to the home page, which shows an overview of the current configuration.
- Application Control:
Opens the Application Control, which provides an overview of all configured applications. Also, it lets you block or enable traffic for those applications, and it lets you activate or deactivate the relevant ruleset.
- Administration:
Opens a submenu that you can use to make system-wide settings and to retrieve information.
- My Profile:
Opens an editing form for your own user data.
- Traffic Manager:
Takes you to the Traffic Manager Admin UI.
- Documentation:
Opens online help.
Navigation area
In the navigation area there are two top-level entries:
- Application Mapping determines which requests are handled by which ruleset and by which settings.
- Application Control lists all applications alphabetically. (Applications in vWAF are often identical with your web applications—but not necessarily.) If you click an entry, you can edit the underlying ruleset.
Clicking the Application Control heading takes you to the overview of all configured applications (this is equivalent to the menu item Application Control).
Interaction area
The interaction area, located in the middle, changes depending on the menu item selected and depending on the element selected in the navigation area. This is the place where most of the information is shown and where you carry out your configuration work.
Logout
You can log out here.
Status display
The status display provides a summary of the status of the configuration that you’re currently editing:
- Messages:
Only appears when there’s a current message.
When an action has been completed successfully (e.g., a handler is added or changed), confirmation is displayed here on a green background. Warnings are displayed on a red background.
- Logged in as:
Displays the username of the administrator who is currently logged in (your username).
- Group Membership
Displays all user groups to which you belong. If you belong to the user group “zeusafm Administrator”, only this group is listed as it always includes all user rights of all other groups as well.
- Ruleset
Only appears when a particular application has been selected in the navigation area. Displays the version number of the ruleset that’s currently being edited, and shows whether this ruleset is active as a protection or detection ruleset. Also shows which capability has been assigned to the corresponding application (see Assigning Capabilities).
- Changes
Only appears when a particular application has been selected in the navigation area:
- Number of changes shows the number of changes made to the selected application since the last commit operation.
- View Changes only appears when there are current changes, in other words when the value of Number of Changes isn’t equal to zero. If you click the link or on the green arrow symbol, the Change Log opens (see Reviewing and Discarding Ruleset Changes and Committing and Activating Ruleset Changes).
- Application Control
Only appears when a particular application is selected in the navigation area. Lets you view and modify whether traffic is allowed or blocked for this application, and whether the ruleset for the application is active. This is identical to the features provided when selecting the menu item Application Control (see Application Control for details).
- Application Status
Only appears when a particular application has been selected in the navigation area. Shows application-specific states, messages and warnings. For example, after you’ve used the Suggest Rules Wizard, a message appears here while learning mode is enabled for the application.
- Cluster Status
If all cluster nodes are running, shows the total number of cluster nodes (for example, “All (2) cluster members running.”)
If not all cluster members are running, the display shows in different colors the number of nodes that are:- on line (green): cluster members are enabled and active
- off line (orange): cluster members are disabled
- degraded (red): cluster members are enabled but not active
If you click one of the colored entries, this takes you directly to the Decider Cluster Nodes tab in Cluster Management (see Managing Deciders).
- Automatic Logout
If there hasn’t been any activity within the administration interface for some time, a warning message appears and notifies you how much time remains until you’ll be automatically logged out by the system.
ATTENTIONWhen you’re logged out automatically, all changes that you haven’t committed are lost. See When Changes Are Saved and Become Active and Committing and Activating Ruleset Changes for details.