Viewing Pulse One Dashboards
Viewing Overall System Health
To view metrics for system health, select the Dashboard tab, and then select the Overall tab. For example:
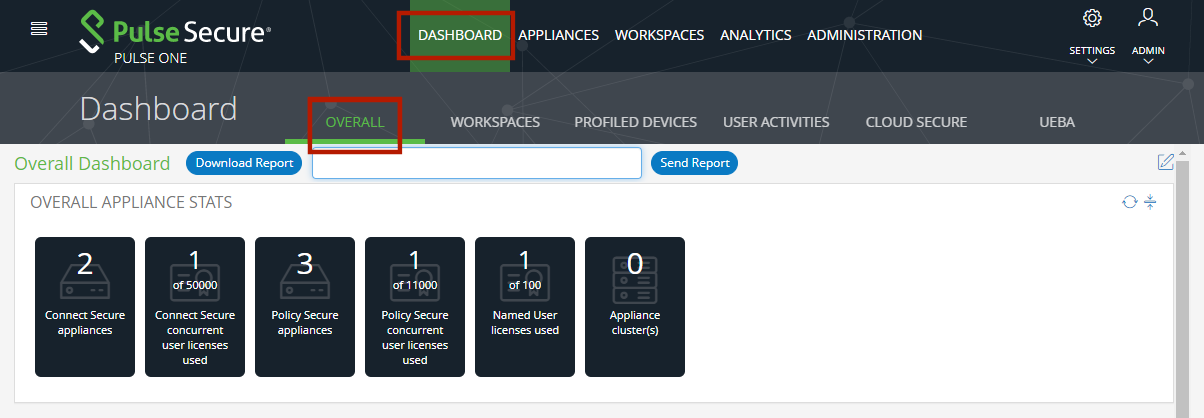
This dashboard includes the following widgets by default:
•Overall appliance statistics.
•Appliance health for individual appliances.
•User login activity.
•VPN realm usage.
•Role usage.
•Frequent user logins.
•Logins in the past 24 hours.
•Critical appliance events.
•Resource dial.
•Pulse Connect Secure versions.
•Pulse Policy Secure versions.
•Appliance concurrent users.
Each widget that can be refreshed by clicking Reload Widget Content (![]() ) and collapsed by clicking Collapse/Expand Widget (
) and collapsed by clicking Collapse/Expand Widget (![]() ).
).
Click Download Report to create and download a multi-page PDF report that includes each widget that currently displays a populated graph. To send the graph via email, enter an email address and click Send Report.