nZTA Administration
This chapter covers the following topics:
•Viewing Licensing/Subscription Usage
•Associating Geographical Locations to IP Addresses
•Synchronizing the Configuration
Viewing Licensing/Subscription Usage
Licenses and subscriptions are added to the Controller by Ivanti.
The Subscriptions page displays your licenses and subscriptions that are active on the Controller. To access this page, select Administration > Subscriptions.
The Summary tab displays for each subscription or license:
- License/Subscription high-level details, including dates and usage metrics.
- One or more descriptions of the features in the license or subscription. Where there are multiple features, use Previous and Next to navigate.
When any defined limit on the license or subscription is met, a message appears:
- At 75% utilization of seats, an information message appears at the bottom of the screen. You can optionally select Close.
- At 90% utilization of seats, a modal message appears at login. Select Dismiss to clear the message.
- When 25% of the duration of the license or subscription remains, a modal message appears at login. Select Dismiss to clear the message.
Named Users lists users and their devices registered on the Controller.
Summary information for Controller licenses and subscriptions is displayed at the top of the page:
- The total number of seats from all licenses or subscriptions.
- The number of named users on the Controller. Each of these is listed in the table below the summary.
- The percentage of seats consumed.
For each named user, the following information is displayed:
- The name of the user.
- The number of devices enrolled for that user.
- The elapsed time since the most recent session on a device enrolled for that user. If this is greater than 3 weeks, this is displayed in orange.
- The timestamp for the start of the most recent login session.
For details about upgrading the client packages, see Upgrading Ivanti Secure Access Client and Working with ESAP Packages.
Creating Admin Roles
With Role-based access control (RBAC), organizations can easily add admins and assign them specific roles, with differing levels of access to the nSA Admin Portal. In addition to an existing set of default roles, Administrators can now create custom granular roles for specific functions within the nSA admin portal.
For details about creating roles, see Role-based Access Control for Admin Users
Associating Geographical Locations to IP Addresses
nZTA provides the mapping of Gateway geographic location to IP address.
Before you start, make sure that you have the following information:
- The public IP address/range for the Gateway. This is the IP address at which clients can externally reach the Gateway.
- The Gateway geographic location information such as country, state/province and city.
To add a new location:
-
Log into the Controller as a Tenant Admin, see Logging in as a Tenant Administrator.
The My Home page appears by default.
-
From the nZTA menu, click the Administration icon, then select Custom Geo IP.
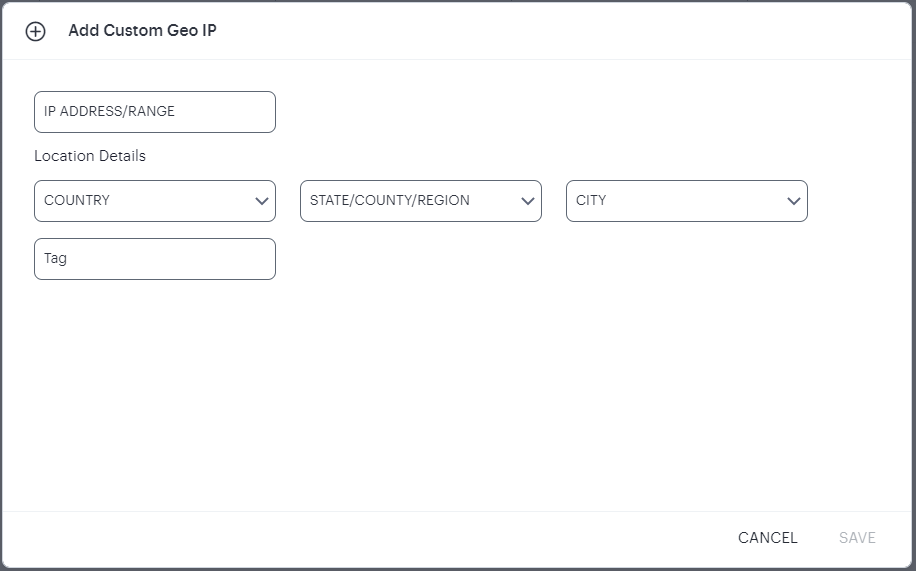
The Custom Geo IP page appears. This page lists all defined geographical associations to IP addresses.
- Click "+" at the top of the page.
- Enter the IP Address/range.
- Select the Country.
- Select the State/Province.
- Select the City.
- Enter a Tag for this IP Address/range.
- Click Save.
Checking Tenant Admin Logs
The Tenant Admin Audit logs page captures all tenant operations and gateway operations. Any reports/log export scheduled will have the logs captured in the event logs.
The logs include details of create, update, delete and re-order operations on Secure Access Policies, Applications, Application Groups, Device Polices, User Management, Gateways and installation packages, and actions on enrolled devices, MDM, Syslog Config, and Custom Geo IPs.
The log retention period is 90 days.
Audit Log Improvements
To provide a more consistent and intuitive auditing experience across NSA-ICS and NSA-ZTA, several audit log enhancements have been made.
•Standardized Audit Log Paths
Audit events that are shared between ICS and ZTA previously included ICS-specific navigation paths. This is confusing when viewed in ZTA. Audit log entries have been updated to use product-neutral terminology, ensuring the information is relevant regardless of the platform.
Examples
Before:
Created: Admin Management > Authentication Servers > {name}, type: {type}
Deleted: Admin Management > Authentication Servers > {name}
After:
Created: Authentication Servers > {name}, type: {type}
Deleted: Authentication Servers > {name}
Updated: Authentication Servers > {name} > Updated user: {user}
•Unified User and Administrator Terminology
Historically, ICS only supported administrator user management, resulting in audit log entries using administrator-specific labels such as Admin Rules, Admin Policies, and Admin Groups. Since ZTA supports management of both administrator and standard users through the Admin Portal, audit logs have been updated to use terminology that reflects this broader scope.
Examples
Before:
Created: Admin Management > Admin Rules > {name} type: {type} and value: {value}
Updated: Admin Management > Admin Policies > {name}
After:
Created: Admin/User Rules > {name} type: {type} and value: {value}
Updated: Admin/User Policies > {name}
These changes improve audit log readability, remove product-specific references, and provide consistent terminology across shared ICS and ZTA administrative workflows.
To view the Tenant Admin Logs page:
-
Log into the Controller as a Tenant Admin, see Logging in as a Tenant Administrator.
The My Home page appears by default.
-
From the nZTA menu, click the Administration icon, then select Tenant Logs.
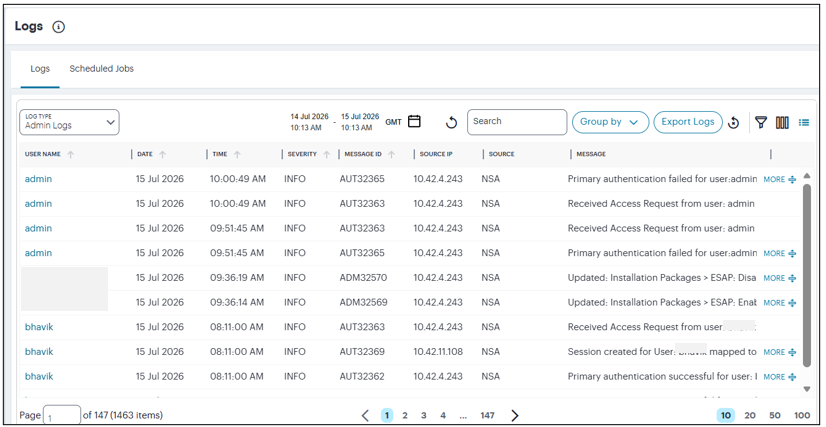
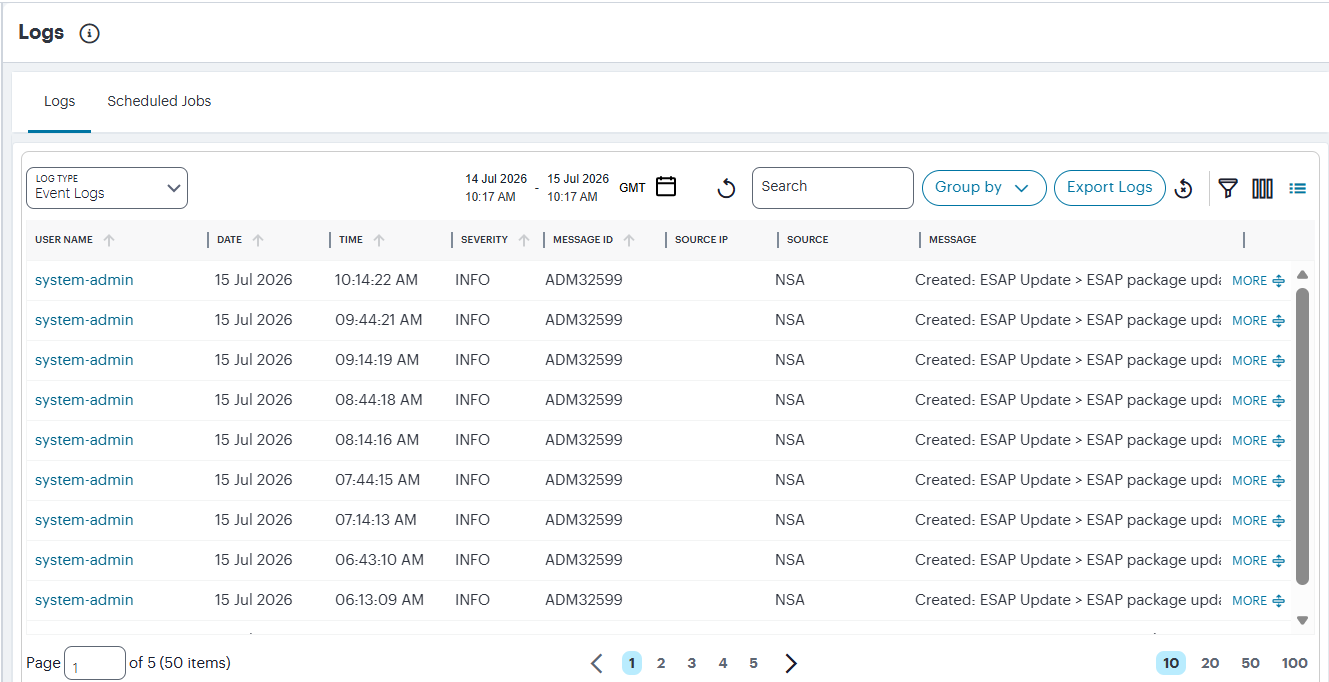
The Tenant Admin Logs page is displayed showing a list of Admin logs, by default, for all the admin activities. To view event logs, select Log Type > Event Logs. All the historical data are shown in the event logs page.
The table shows the log generated date and time, "Severity", "Message ID" and "Message", and "Source IP" and "Source" Gateway name.
The example screens show admin logs and event logs.
•Use the time period selectors at the top of the page to set a time period or time range for your log results. For details, see Setting a Log Time Period.
•Logs are refreshed automatically by changing the criteria. To manually refresh the log display, click the following icon:

•To group the logs based on the fields, use the Group by button and select the field type to view the table information in groups.
•To export the displayed log as a CSV or JSON text file, or to set up a new scheduled log export job, click the Export Logs button. To learn more about log export jobs, see Exporting Logs.
•To trigger the advanced filter selection, use the following icon. For details, see Filtering the Logs.

•To reset the filter, click the following icon:

•To change the fields displayed for each log line, click the following icon:

•To change the view density, click the following icon:

Synchronizing the Configuration
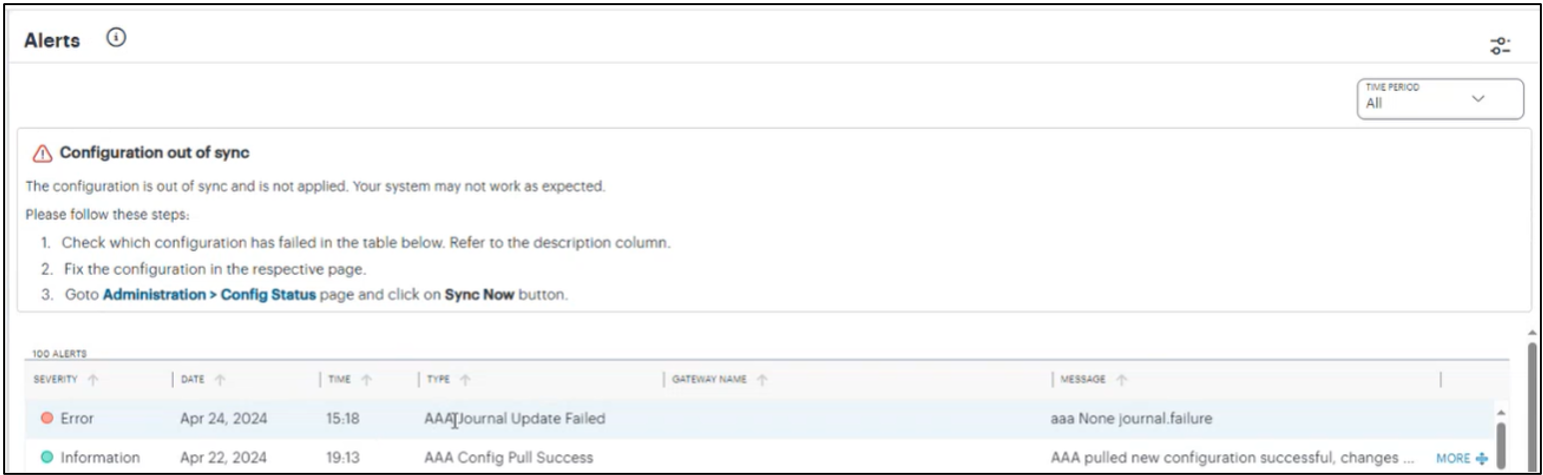
When admin modifies or updates a device policy or a secure access policy and applies the changes, the synchronization might fail due to any wrong values in the configuration. The Alerts page shows the error log.
Based on the error log information, analyze and fix the configuration. Then use the Sync Now option to initiate the configuration synchronization.
To synchronize configuration:
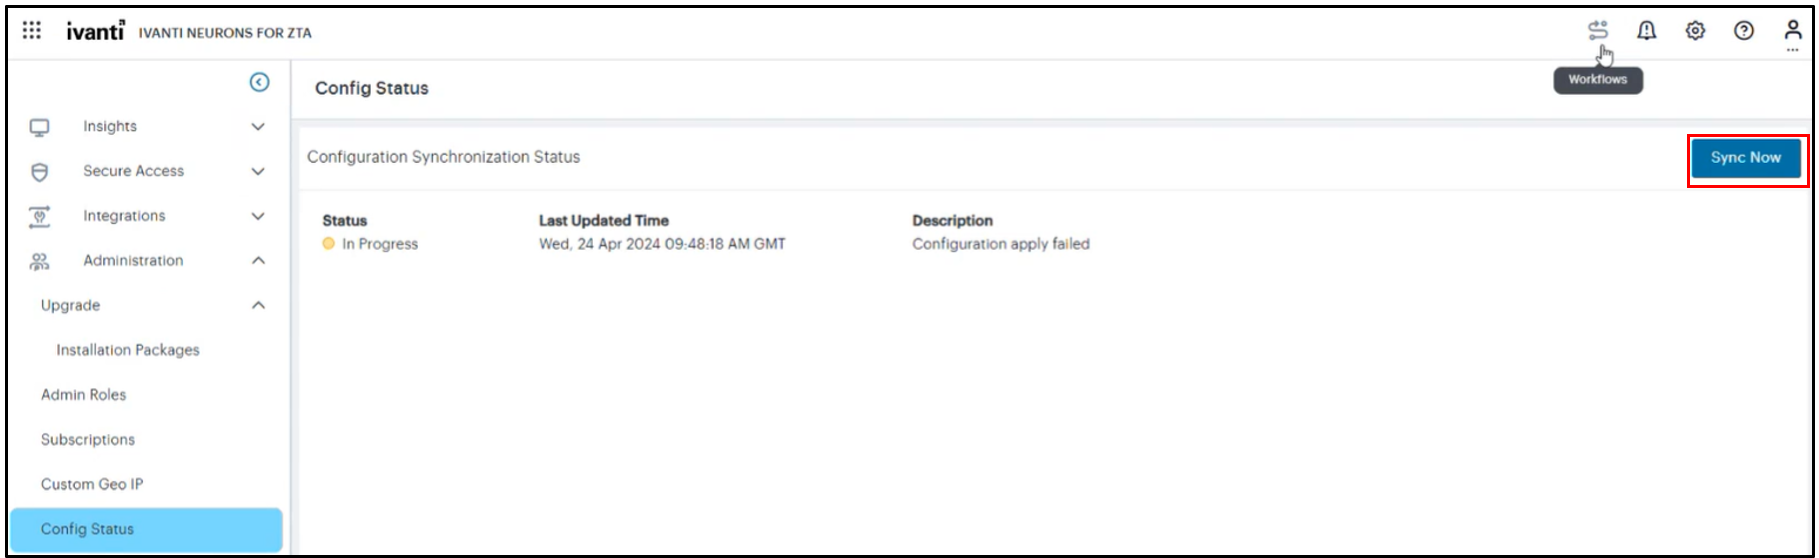
1.From the nZTA menu, select Administration > Config Status.
The Config Status page shows the status of the config sync, the last updated dated and time, and a brief description of config sync.
2.Click Sync Now.
The Status column displays Success when the configuration synchronization is successful, and the Sync Now button is disabled.