Tour a Dashboard
Dashboards are highly configurable so no two Dashboards necessarily look or behave alike.
The following figure shows an example Dashboard. The individual components are different kinds of Widgets.
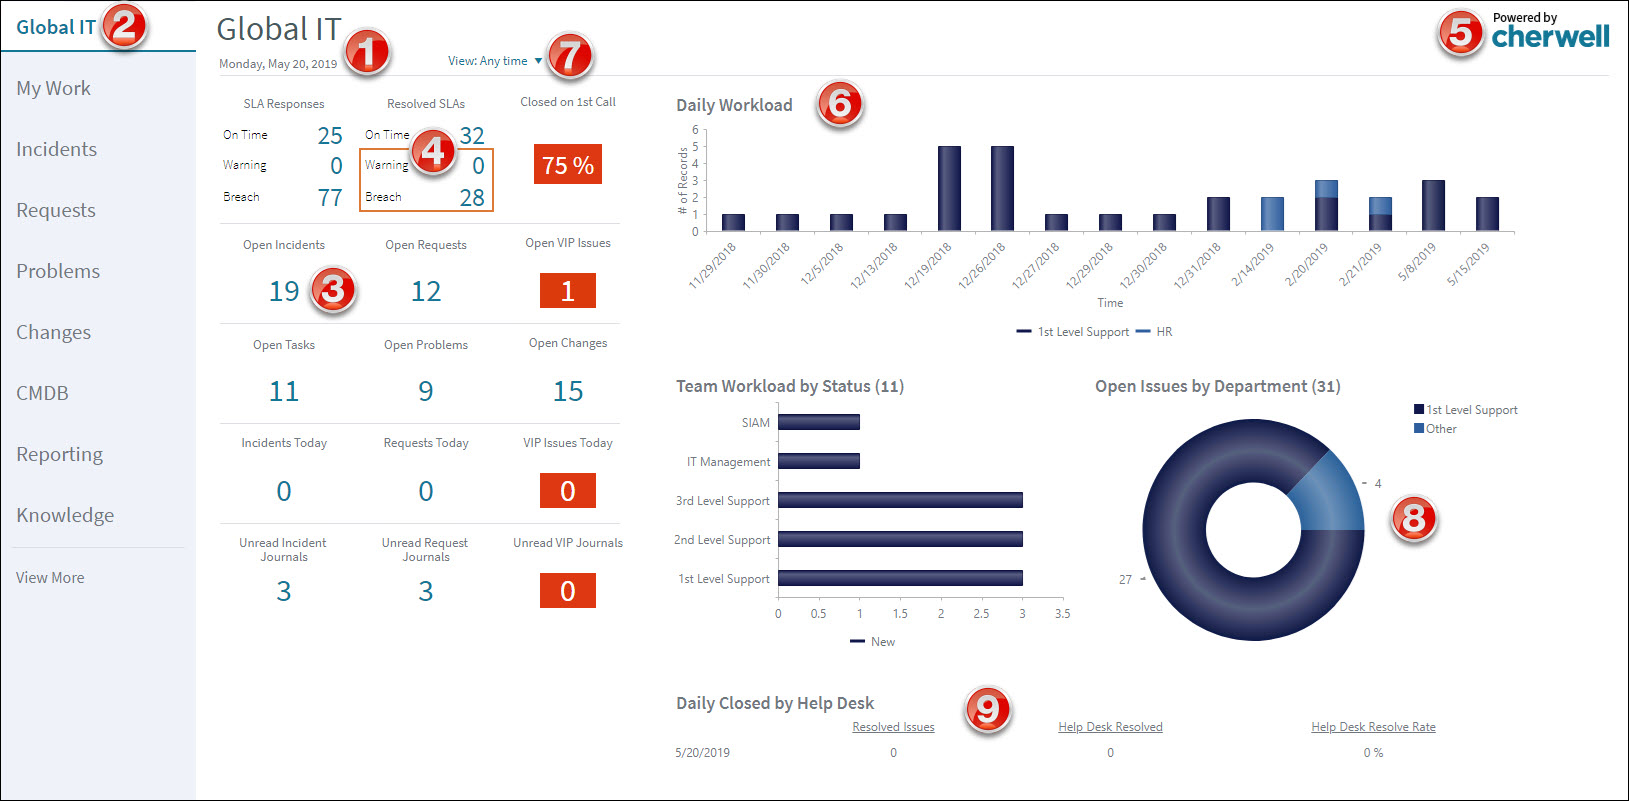
- Text Widget (Expression-driven): Displays the current day and date.
- Link Widget: Opens another Dashboard (ex: Global IT Dashboard).
- Gauge Widget with Text: Displays the current number of open records (ex: Open Incidents) by type.
- Gauge Widget with Text (Expression-driven, text, and visibility): Displays alert when a threshold is passed (ex: SLA warnings and breaches).
- Image Widget: Displays a custom image (ex: company logo).
- Chart Widget (Stacked Bar): Displays workloads by department.
- Filter Widget: Filters all Widgets by time (ex: Today, Yesterday, Within last week, etc.).
- Chart Widget (Doughnut): Displays Incident workloads by department.
- Matrix Widget: Displays daily record closure rates.
The following types of Widgets are also available for use on Dashboards:
- Action Catalog Widget: Embeds a service catalog within a Dashboard.
- Browser Widget: Serves as an embedded iFrame to display other HTML Pages or websites. (ex: Your company's website).
- Command Palette Widget: Displays a list of one or more executable Actions (run a command or display a CSM Item).
- RSS Feed Widget: Displays frequently updated information, such as news or blog entries, from a particular feed.
- Search Widget: Displays a Search Control that can be used to run Quick Searches or specific searches.
- Search Results List Widget: Displays a list of records that meets search criteria.
- Twitter Feed Widget:
Displays entries from a Twitter account or search.
Tip: In the Desktop Client, use the Dashboard context (right-click) menu to quickly access common Dashboard operations.