Create a Gauge Widget
Use the Gauge Widget Properties window (accessed from within the Widget Manager) to create a Gauge Widget.
To create a Gauge Widget:
- Create a Widget.
- In the
Type drop-down list, select
Gauge.
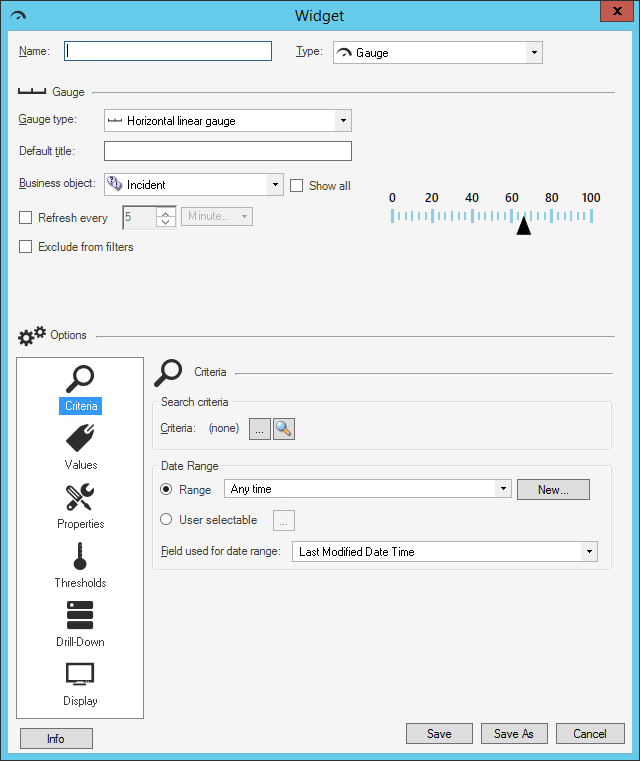
The Gauge Widget Properties window opens, displaying several pages (Criteria, Values, Properties, Thresholds/Numbers, Drill-Down, and Display). Text and Numeric gauges display the Number Properties page; all other Widgets display the Thresholds page.
- Define general properties:
- Gauge Type:
Select the type of gauge:
- Horizontal (Linear)
- Numeric (Digital or Mechanical)
- Speedometer (Angle, Rectangular, Round, Round Rectangular)
- Text
- Thermometer (Linear)
- Vertical (Linear)
- Default
Title:
Provide the title to display above the widget. The font, style, and color is inherited from the dashboard on which this widget resides.
Note: You can change this title (Controls text box) when you put the Widget on a Dashboard; however, the title is not dynamic so changes are not pushed back to this field. Likewise, if you later change this title in Widget Properties, the changes are NOT pushed out to all the places it resides on Dashboards. For more formatting flexibility, use a "floating" Text Widget to display a label or title for a Widget.
- Business
Object:
Select the Business Object whose data to include in the gauge (example: Incident data). Only one type of Business Object can be selected. The drop-down list displays only Major Business Objects. To display all Business Objects, select the Show All check box.
Select this check box to refresh the content according to a defined time period, and then provide the refresh timeframe (every x hours or minutes).
- Exclude From
Filters:
Select this check box to exclude the Widget from being filtered by any filter (Filter Widget) being used on a Dashboard. (Dashboard filters limit multiple Widgets/data series at once). Typically, this is selected if the Widget has its own Date/Time filter.
- Gauge Type:
Select the type of gauge:
- Define the following
properties:
- Criteria: Data/records to include in the gauge (example: Open Incidents). Data is located/filtered using a saved Search Query (Saved Search) or a custom Search Query.
- Values: Value to display in the gauge (example: Number of records, Function, Duration, or Metric).
- Properties (Scale): Minimum/maximum values to use for the gauge's scale, as well as scale orientation and direction.
- Threshold:
Thresholds/threshold colors for the gauge (example: Start, Middle, and End
ranges).
-or-
- Number: Text and number formats for the gauge (example: Decimals, leading zeroes, etc.).
- Drill-Down: Drill-down behavior (example: Go to a Record List, Execute a command, or Go to a Dashboard).
- Display: Enable animation, and color and style overrides.
- Select Save.