About the Operations Monitor
The Operations Monitor is designed to give you a single console from which to monitor background tasks. The background tasks currently monitored include patch scans, patch downloads, patch deployments,
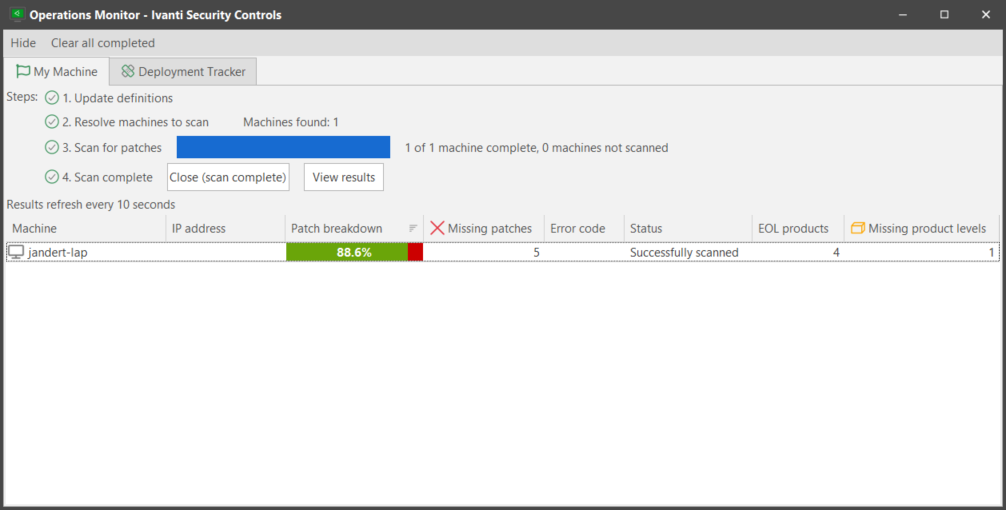
The Operations Monitor is displayed automatically whenever one of these background tasks is performed. To manually access the Operations Monitor, select View > Operations Monitor.
You can export machine information from any of the Operations Monitor tabs by right-clicking in the machine grid and selecting Export selected machines to CSV. To add or remove columns in the bottom pane, right-click on a column heading and select Column Chooser.
|
Field |
Description |
|---|---|
|
Hide |
Minimizes the Operations Monitor dialog. |
|
Clear All Completed |
Removes all completed tasks from all tabs. |
|
Patch scans |
Displays a unique tab for each machine group, domain, or favorite that is being scanned. The tab shows the steps involved in the patch scan and the progress of each step. See Monitoring a Patch Scan for more information. |
|
Patch downloads tab |
Displays status information about patch downloads that have been initiated from the console. |
|
Deployment Tracker tab |
Monitors the status of patch deployment tasks. See About the Deployment Tracker Dialog for more information. |
|
ESXi Hypervisor scans |
|
|
ESXi Hypervisor deployments |
|
|
Asset scans |
Displays a unique tab for each machine group, domain, or favorite that is being scanned. The tab shows the steps involved in the asset scan and the progress of each step. See Monitoring an Asset Scan for more information. |
|
Power Tasks |
Displays status information about power management tasks that run immediately after they are initiated. For more information on power commands initiated using the Power Management function, see Monitoring a Power Task. For information about power commands initiated using the Virtual Inventory feature, see Performing Actions on Virtual Machines. |
|
Agent Installations tab |
Displays status information about agents that have been "push installed" from the console to the machines in your network. |
|
Agent Command Results tab |
Displays status information about commands that have been issued to your agents. |
|
Script executions |
Displays a unique tab for each script that is executed. The tab shows when a script is running, when it is complete, and the status of the script when it is complete (successful, error, etc.). |
|
Security Controls includes the ability to perform a test deployment for any patches that are to be deployed. This is especially useful for patch deployment that has been scheduled for a later time. Testing the deployment allows you to correct any potential problems in a deployment and make it less likely that a deployment will fail. The Test Patch Deployment tab displays the results of a test deployment. A test deploy returns either a pass or a fail depending on what it finds. For example, if the Workstation or Scheduling services are not started in a particular machine, Security Controls cannot deploy patches to it and a test deploy will return a failing result. |