The Dashboard Designer
A dashboard enables you to display lists, charts, and gauges that are based on data from your database, along with web pages and shortcuts that provide access to further information and other components. These show you at a glance a range of data relevant to your work, for example your Workload List. You customize dashboards using the Dashboard Designer.
To start the Dashboard Designer:
- On the Settings menu, click Dashboard.
The Dashboard Designer starts.
Alternatively, click the Select Dashboard toolbar button, then click Dashboard designer.
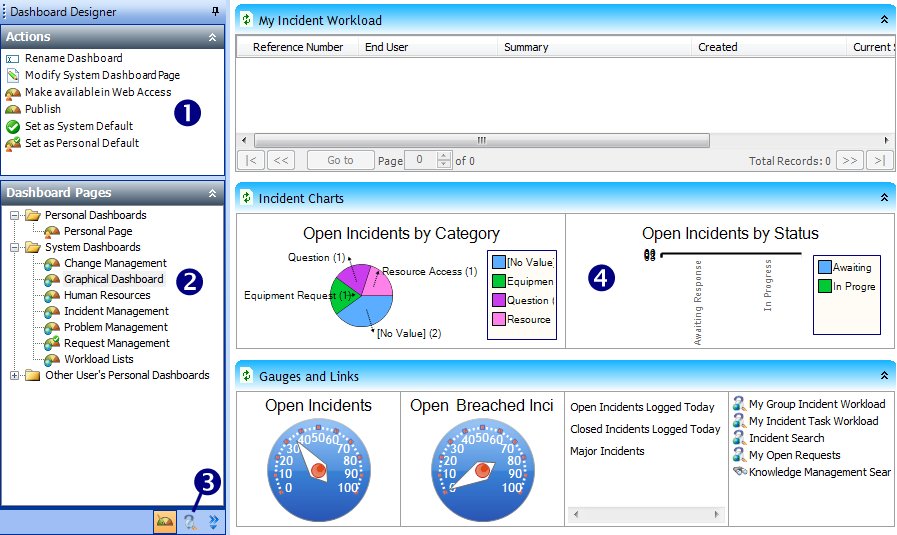
The Dashboard designer comprises four areas:
1 – The Actions list provides access to design commands
2 –  The Dashboard Pages tree lists the dashboards that are available to be designed
3 –  The Queries tree provides access to the queries you can use on your dashboards
4 – The design area, where you design your dashboards
If required, you can display both the Dashboard Pages and Queries trees at the same time. To do this, right-click the icon for the tree, then click Split Panel.