About Xtraction viewers
This topic is a quick start guide for end users of Xtraction who are not assigned an Xtraction user role. If you're such a user (or "viewer"), you have view-only access to certain folders within Xtraction that may contain:
• Dashboards, which display interactive, real-time data imported from your company's application databases. Dashboards present data in an easily digested format, enabling you to gain insight into how the business operates. For service desk analysts, this could mean viewing a dashboard that presents a snapshot of incident-related data from the last month; for security administrators, it could mean understanding more about patch-management-related issues.
•Documents, which are in-depth status reports of the same data. Documents can contain charts, graphs, or lists that can run to multiple pages (Word or PDF files), tabs (Excel spreadsheets), or slides (PowerPoint presentations).
As a viewer, you can also:
•
![]() Export dashboards and documents to formats that enable you to email the content to others or save for future reference. For details, see Dashboard Designer or Document Designer and scroll down to the Exporting section of the topic.
Export dashboards and documents to formats that enable you to email the content to others or save for future reference. For details, see Dashboard Designer or Document Designer and scroll down to the Exporting section of the topic.
•
![]() Access the Open dialog, which is most useful for searching for specific items when a folder list is long and for reopening recently viewed items.
Access the Open dialog, which is most useful for searching for specific items when a folder list is long and for reopening recently viewed items.
1.Open a web browser (Chrome is recommended) and enter the URL to the Xtraction web server provided by the Xtraction administrator.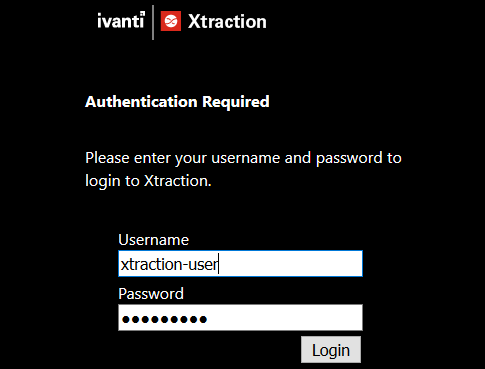
2.Authenticate with the server using one of two methods:
•Windows authentication: If you're already authenticated to the domain, you shouldn't have to re-enter your credentials. If prompted, enter your Windows user ID and password.
Later on, you should be able to log back in to Xtraction automatically by clicking the Click here to login again link on the login page, though your browser type and configuration will determine if this works:
•If your browser is configured to automatically pass the current credentials back to the Xtraction web server, login is automatic. Microsoft Edge usually works this way in corporate environments.
•If your browser is not configured to automatically pass the current credentials back to the Xtraction web server, you’re given a chance to use different credentials. You'll be prompted by the browser—not by Xtraction—for your Windows username and password, which are then passed to the web server. Firefox and Chrome often work this way in corporate environments.
•Local authentication: Enter the username and password provided by the Xtraction administrator. Once you're authenticated, Xtraction will open in your browser.
An Xtraction session will time out after a certain period. A pop-up dialog will display with a countdown enabling you to cancel the timeout before the session ends.
The best way to log out is to use the Logout option at the bottom of the page.
Viewing a dashboard or document
After you open Xtraction for the first time, you're presented with a blank canvas.
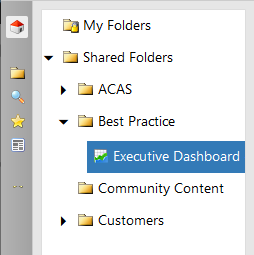
You can use the left pane to navigate the folder list for an item you want to view. Expand either My Folders or Shared Folders, then click a dashboard ![]() or document
or document ![]() name to open it. If you don't have sufficient permissions to view an item, a message will display at the bottom of the page.
name to open it. If you don't have sufficient permissions to view an item, a message will display at the bottom of the page.
Dashboards
An opened dashboard looks similar to this:
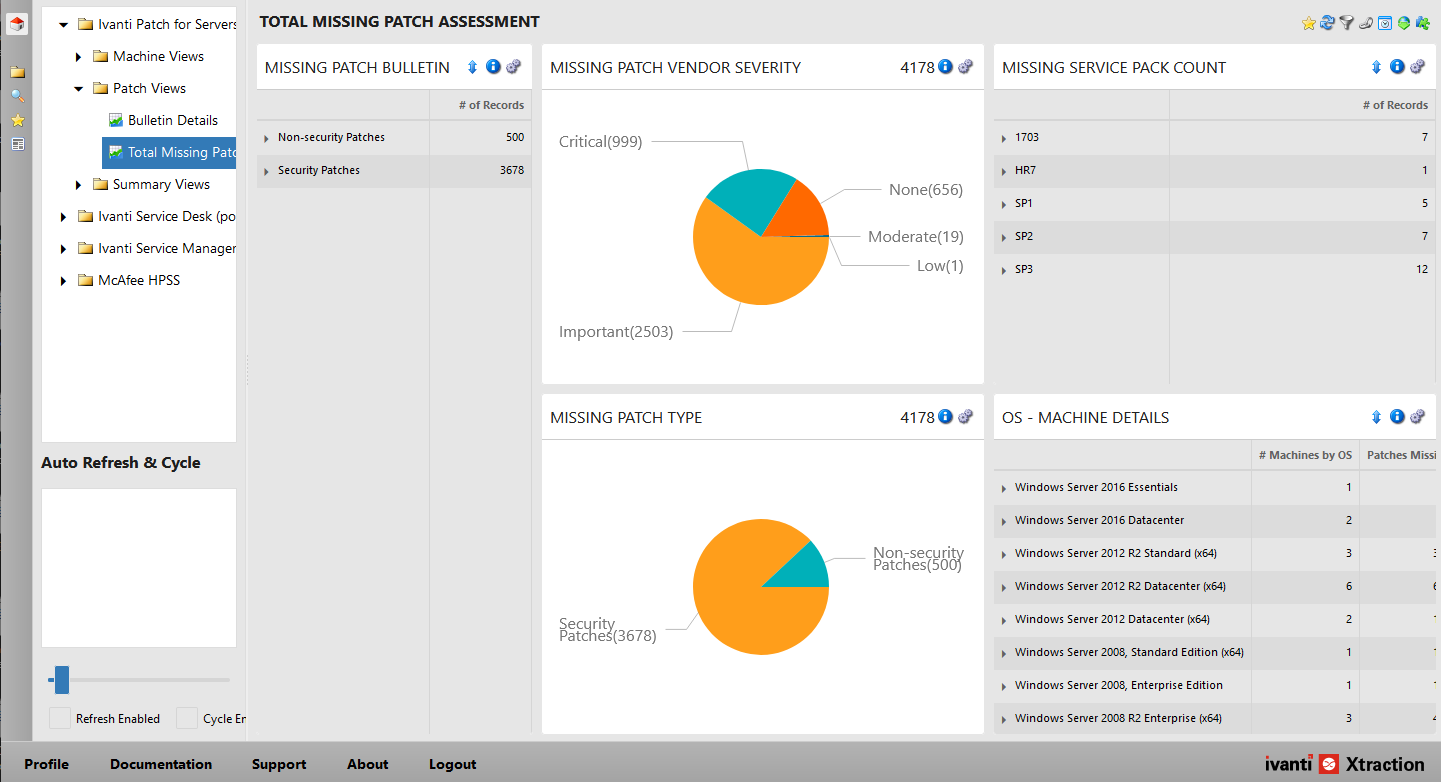
Each dashboard comprises any number of individual panes, each displaying a specific type of data identified by the pane title. Within each pane, you can drill deeper to view the underlying data.
Within each pane of a dashboard there's underlying data that provides more detail (though what you can view is dependent on the type of data displayed).
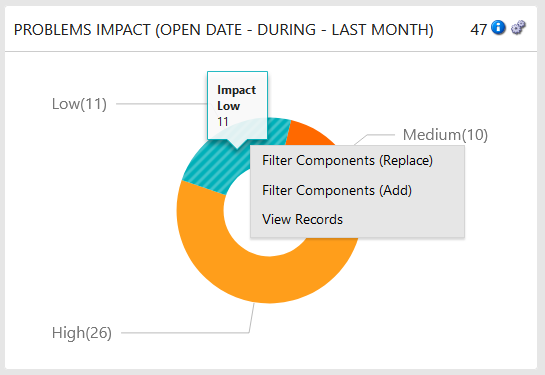
Click the record count number in a pane header ("47" in the image below) to display the full list of records underlying the data. Not all panes have record counts.
Click a single data point (such as "Impact Low" in the image below) to:
•Filter Components (Replace): Select to create a temporary filter condition that dynamically filters the rest of the dashboard based on that data point. For example: In the image below, an "Impact Low" filter condition would be applied to each pane in the display to show just the data that relates to low-impact problems from the past month.
•Filter Components (Add): Select to filter the dashboard by combining the first temporary filter condition with a second one based on an additional data point.
•To clear all temporary filters and re-establish the original view: In the pane header, click the ![]() icon. (You may need to click the
icon. (You may need to click the ![]() icon first to expand the icon list.)
icon first to expand the icon list.)
•View Records: Select to display the underlying records contained within a data point. From the display, you can sort columns, export the data, and double-click a record to display it in its native application (if enabled by the Xtraction administrator). Click Close in the bottom right corner of the View Records page to return to the dashboard view.
Documents
An opened document looks similar to this:
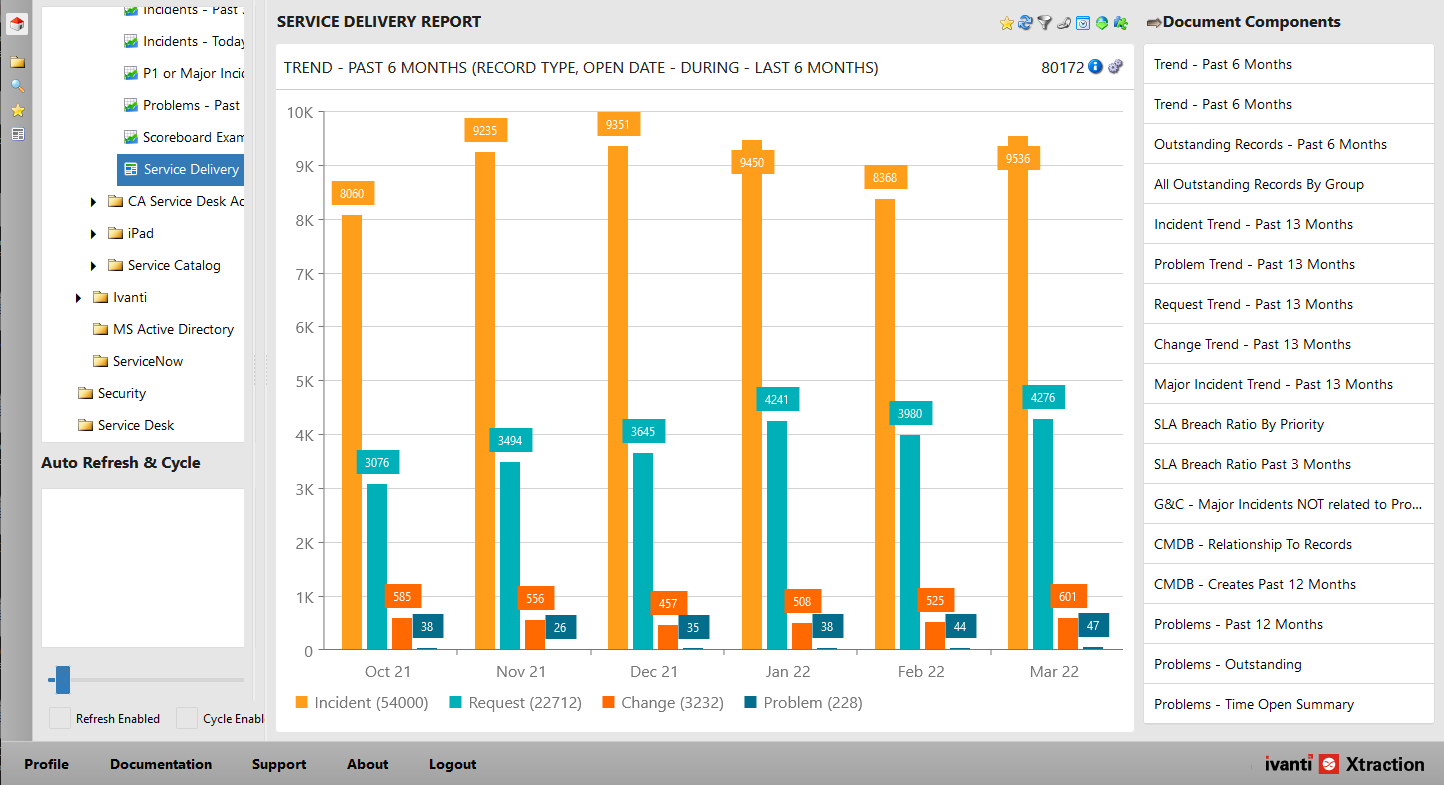
Documents display in two distinct panes:
•The central pane graphically displays one component at a time that's included in the document.
•The right pane displays the Document Components list, which lists all of the components included in the document layout. Click any one of the listed components to display it in the central pane.
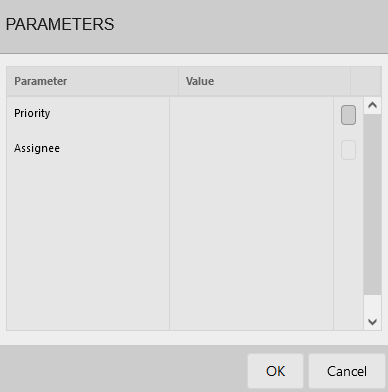
A document may contain parameters that filter the viewable data. For example, if a document shows all open incidents, the creator may have added parameters to filter the data by incident Priority and Assignee. If parameters are included, a Parameters dialog will display upon opening the document. You'll be prompted to select a value for the parameter before the document loads.
Select a value for each listed parameter by clicking  the at the end of each row and following the prompts. The list of values is pulled from an associated field in the application database that Xtraction is reporting on.